A hotel marketer opens the dashboard and sees a pattern that feels familiar. Visitors click into the 360° tour, linger on a few hotspots, then disappear before the booking form ever gets a chance. A real estate team sees the same leak in listing tours, and a university team sees it in campus walkthroughs, interest without enough completed enquiries.
That gap is exactly where conversion funnel analysis earns its place. Modern analytics vendors frame it around three core tasks, defining the funnel steps, measuring conversion between each step, and diagnosing drop-off points, which is why it has become a standard digital analytics practice across websites, apps, and email journeys since the 2010s (Mixpanel on funnel analysis). For teams trying to clean up broken journeys, a practical companion resource is addressing broken funnels, especially when the problem isn't traffic volume but friction between clicks and conversion.
If the current setup feels like separate tools, conflicting reports, and a lot of guessing, that's normal. The path forward is to define stages cleanly, track the right actions, segment the right users, and then test only the fixes that deserve it. For a real-estate-specific framing, the broader marketing context in Digital Marketing in Real Estate helps show how funnel thinking fits into listing promotion, nurture, and lead capture.
Table of Contents
- Introduction to Conversion Funnel Analysis
- Defining Your Funnel Stages and KPIs
- Implementing Tracking Across Funnel Steps
- Segmenting Users and Visualizing Drop-Off Points
- Creating Hypotheses and Designing A/B Experiments
- Applying Insights for Continuous Optimization
- Conclusion and Next Steps
Introduction to Conversion Funnel Analysis
A funnel only becomes useful when the team agrees on what the stages mean. Without that, one marketer calls a form submit a conversion, another calls a booked meeting a conversion, and the numbers stop telling one story. That confusion is common in lead generation, especially when hospitality, real estate, and education teams all rely on different systems to describe the same user journey.
The point of conversion funnel analysis is simple, but the discipline behind it matters. The modern model is to map the actual path, measure movement from stage to stage, and diagnose where users leave, because that is what turns a vague drop in performance into a fixable problem (Mixpanel on funnel analysis). In practice, that means a tour view, a hotspot interaction, a lead-form start, and a form completion all need to be treated as measurable actions rather than assumptions.
A funnel chart is not the answer. It's the proof that the team should ask better questions.
For property marketers, the leak often shows up after engagement, not before it. Users explore, but they don't raise their hand. For schools, the same pattern appears when students or parents browse a campus experience and never reach the enquiry form. The rest of this guide shows how to define the journey, instrument it cleanly, segment it accurately, and use the results to drive better lead growth.
Defining Your Funnel Stages and KPIs
A strong funnel starts with stage definitions that everyone can repeat in the same way. For a virtual tour journey, the core steps are usually tour view, hotspot interaction, lead-form start, and form completion. In hospitality, that path might tilt toward room exploration and booking enquiry, while in education it might lean toward campus visit, programme page engagement, and admissions enquiry.
The most useful KPI for the overall funnel is still the classic formula, conversions divided by total visitors, multiplied by 100, paired with drop-off at each stage (Copy.ai on conversion funnel analysis). That matters because a funnel can look healthy at a glance while one stage is underperforming unnoticed. Guidance cited in the same benchmark also reports an average sales-funnel conversion rate of 3.1% across 264 million conversions on 44,000 landing pages in 16 industries, with top-quartile funnels above 6.8% and the top 10% above 9.2% (Copy.ai on conversion funnel analysis).
Funnel Stage KPIs by Industry
| Funnel Stage | Real Estate | Hospitality | Education |
|---|---|---|---|
| Tour View | Listing tour starts | Room or venue tour starts | Campus or programme tour starts |
| Hotspot Interaction | Viewing key room features, floorplan points, neighborhood markers | Engaging with amenities, room details, event spaces | Clicking department, facility, or student-life hotspots |
| Lead-Form Start | Request-info or contact form begins | Booking enquiry or quote request begins | Admissions enquiry or brochure request begins |
| Form Completion | Lead submitted | Enquiry submitted | Enquiry submitted |
The KPI choice should follow the stage, not the other way around. A room tour with great viewing time but weak form starts points to interest without intent. A campus tour with strong form starts but poor completions suggests the form itself is the bottleneck, not the tour content.
Implementing Tracking Across Funnel Steps
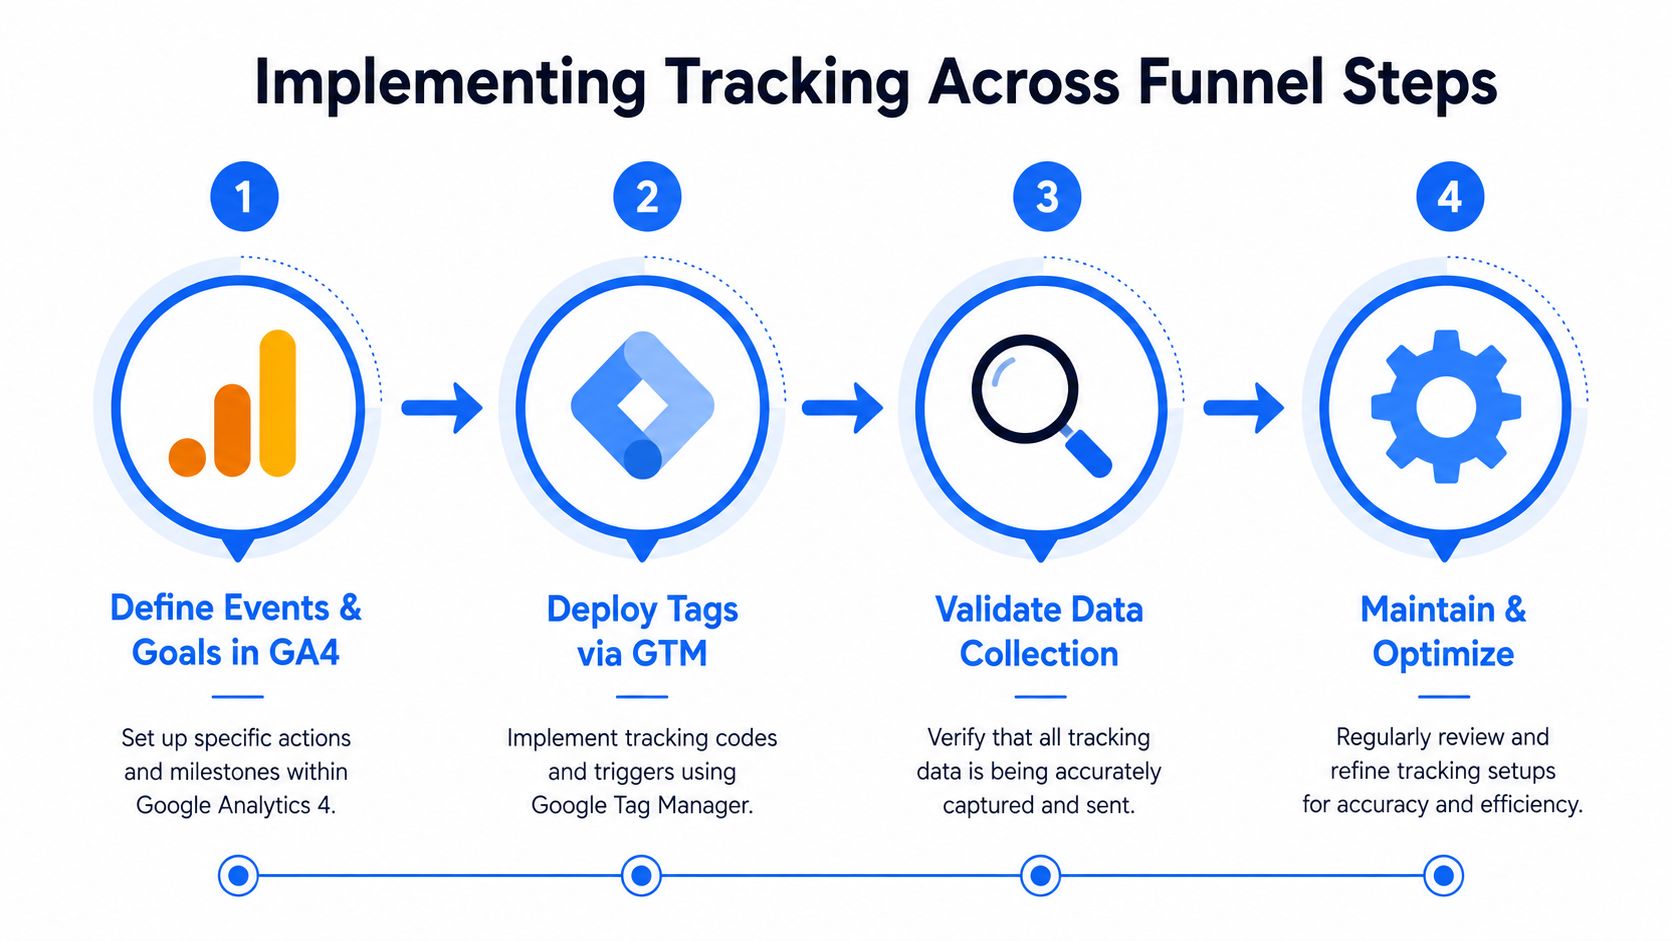
Tracking needs to reflect the actual user path, not a neat diagram someone drew in a workshop. A rigorous workflow starts by defining the path, then instrumenting each stage as an event, deduplicating by user ID, and deciding whether the funnel is strict or open before analysis (MetricGate on funnel analysis and conversion metrics). If repeated views, skipped steps, or re-entries aren't handled carefully, stage counts get distorted and false drop-off signals appear.
For lead generation teams, that means every touchpoint needs one clear home. GA4 can carry the core event model, GTM can deploy the tags, and tracking pixels can validate campaign-level attribution, but the definitions must stay consistent. A lead-form start shouldn't mean one thing in CRM and another thing in analytics, because mixed definitions create false confidence.
The strongest rule is boring but effective. Pick one primary reporting source for each action, use the others for directional validation, and document the definition in plain English (Market with Boost on conversion funnel analysis). That avoids the familiar problem where analytics says one thing, CRM says another, and paid media reports a third version of the truth.
Practical rule: if a stage can't be described in one sentence that a sales rep and a marketer both understand, it isn't ready for tracking.
For implementation details around setup mechanics, the most relevant companion guide is Google Tag Manager setup. That kind of setup work is where many teams lose momentum, because the technical build is easy to start and easy to leave half-finished. Good tracking is less about complexity and more about naming discipline, event clarity, and a clean handoff between analytics, ads, and the form platform.
Segmenting Users and Visualizing Drop-Off Points
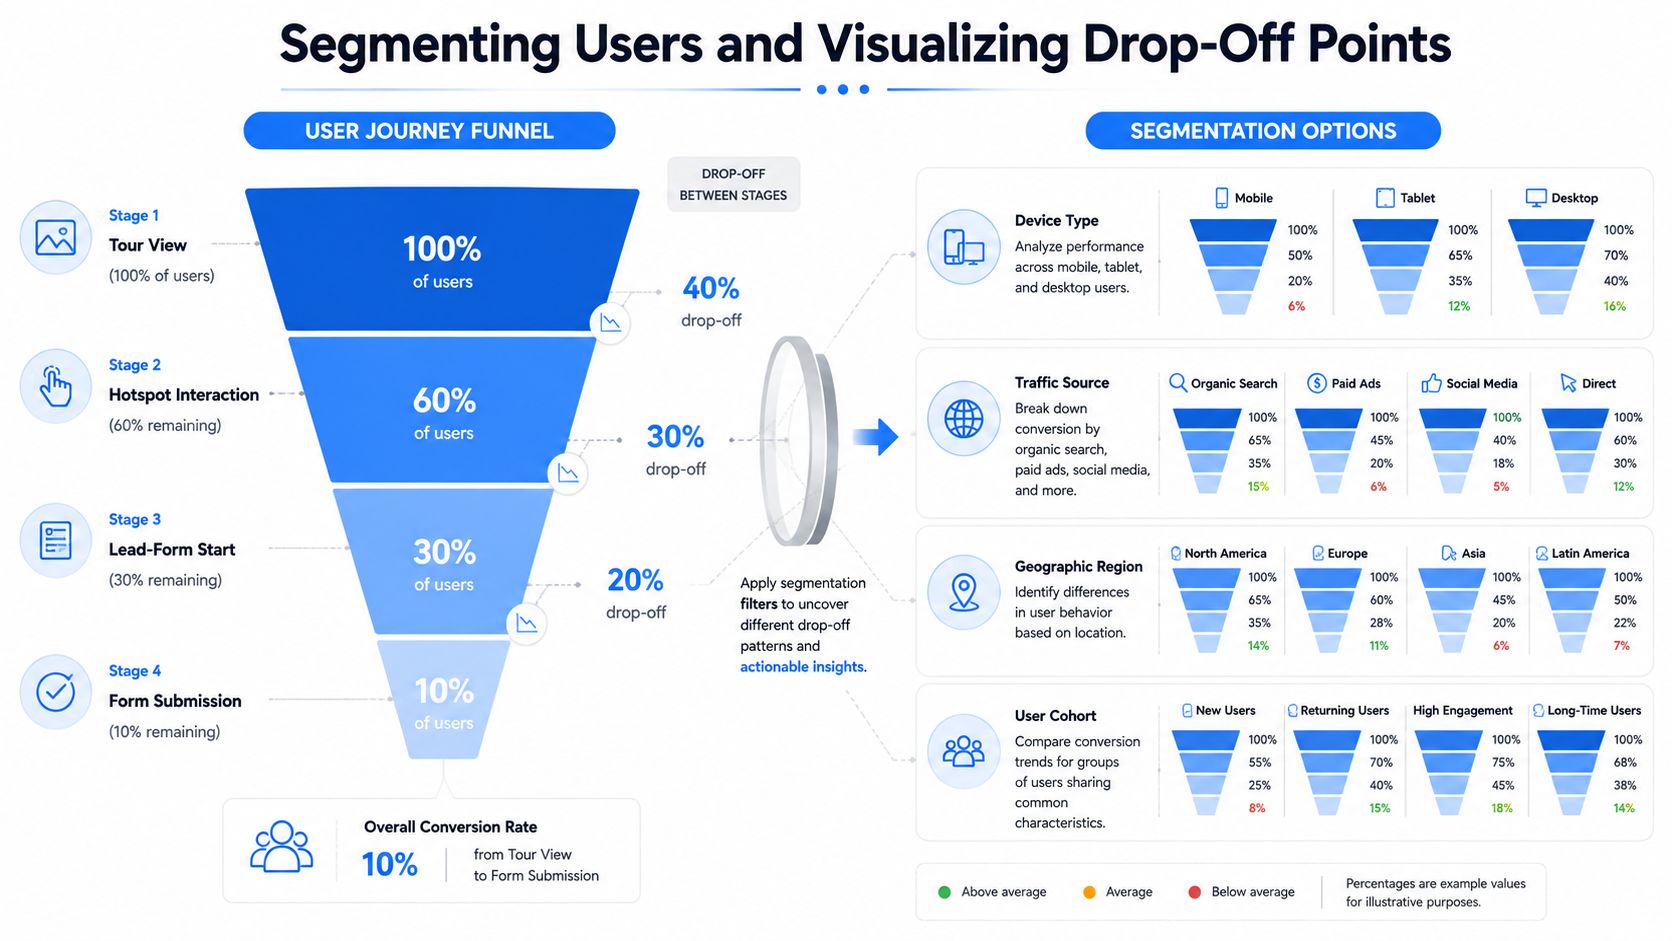
Aggregate funnel performance can hide the problem you need to solve. A funnel can look acceptable overall while mobile users underperform sharply relative to desktop users, which is why experts recommend segmenting by device, source, and cohort before drawing conclusions (MetricGate on funnel analysis and conversion metrics). In lead-gen funnels, that same logic applies to organic traffic, paid traffic, referrals, and returning visitors.
The non-linear journey matters too. Stronger guidance now emphasizes multiple entry points and segmenting by behavior, purchase history, device, campaign, or geography because different audiences need different strategies (Krish Technolabs on conversion funnel analysis). That is especially important in real estate, where first-time viewers often behave differently from repeat visitors, and in education, where mobile research habits may not match desktop enquiry behavior.
A useful way to read the visuals is to keep one question in mind, what changed between the users who moved forward and the users who stopped. Funnel charts show the where, while heatmaps, session patterns, and segment overlays give clues about the why. The two together are stronger than either alone.
What to compare first
- Device type, because mobile friction often hides behind overall averages.
- Traffic source, because referral, paid, and organic visitors usually enter with different intent.
- Geographic region, because location can change expectations and response patterns.
- User cohort, because first-time and repeat visitors rarely convert the same way.
The smartest teams do not just export charts and move on. They line up the funnel view beside the segment view, then look for one segment that is lagging hard enough to justify a focused test. That prevents broad changes that dilute the signal and waste time.
Creating Hypotheses and Designing A/B Experiments
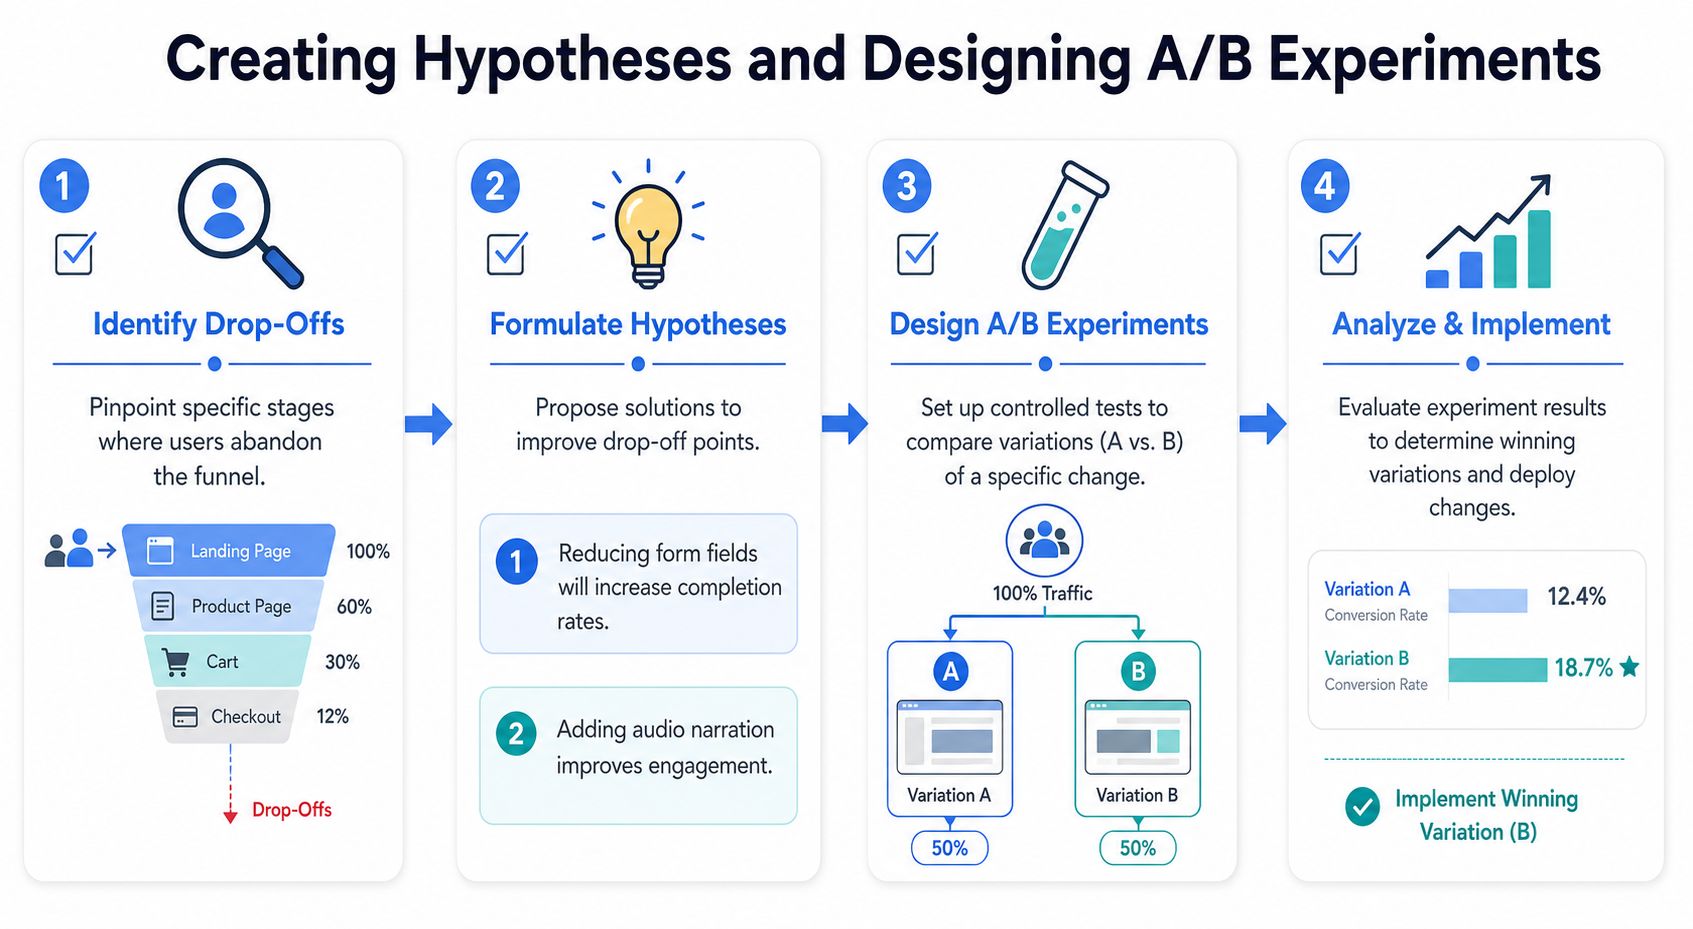
Once the drop-off is visible, the next move is to propose a fix that matches the bottleneck. A campus tour that loses users at form start might need fewer fields. A hospitality walkthrough that shows strong engagement but weak enquiry may need clearer next-step cues or better audio guidance. The hypothesis should point to one change, one audience, and one expected outcome.
The biggest mistake is testing too many things at once. A clean A/B test isolates one variable, so the result can be trusted. That is where a lead-capture flow becomes useful as a test bed, because the form can be improved without rewriting the whole tour experience. A helpful reference for structuring that layer is lead capture forms.
A simple prioritization filter helps teams choose which ideas to test first. ICE scoring, Impact, Confidence, Ease, works well because it forces a discussion about trade-offs instead of chasing every idea that sounds clever. A small wording change on a high-friction form can be more valuable than a larger redesign that takes months to launch.
A good hypothesis reads like a prediction, not a wish. If the team can't explain why the change should affect the next stage, the test is too vague.
The non-linear journey is worth remembering here too. The same visitor may enter through a hotel room page, jump to amenities, return from a remarketing ad, and only then submit an enquiry. Stronger testing doesn't pretend that path is straight, it tests the interaction point that appears to matter most in that segment (Krish Technolabs on conversion funnel analysis).
Applying Insights for Continuous Optimization
Winning experiments only matter if the result changes the funnel the team runs. A good rollout plan starts with the strongest variant, then checks whether the lift survives across device types, traffic sources, and return behavior. If a change improves desktop completion but leaves mobile users behind, the rollout needs a second pass, not a victory lap.
The best teams treat optimization as a cadence, not a campaign. They keep the reporting source definitions stable, review the funnel on a regular schedule, and update the tour experience when the evidence points in one direction. That might mean swapping a hero image, rewriting a hotspot label, simplifying a form field, or changing the order of the tour steps so the lead path feels more natural.
A healthy operating rhythm also depends on alerts and review habits. When GA4 flags an unusual change, the team should know who checks it, who validates it, and who decides whether the issue is a tracking problem or a real behavioral shift. Without that ownership, the dashboard becomes decoration.
The most practical loop looks like this:
- Watch the funnel, not just the total conversion number.
- Compare segments, so the average doesn't hide the problem.
- Ship one change, then confirm that the change held.
- Document the outcome, so future tests don't repeat the same question.
The goal is not more testing for its own sake. The goal is a funnel that gets cleaner over time because each round of analysis produces a decision, and each decision changes the user path a little more in the right direction.
Conclusion and Next Steps
Conversion funnel analysis works when the team treats it as a system, not a chart. The useful sequence is straightforward, map the funnel, implement the tracking, segment and visualize the drop-off, test a focused hypothesis, then keep optimizing with the same definitions intact. That order keeps the work grounded in real behavior instead of dashboard noise.
Three habits help keep momentum. First, set guardrails for what counts as a meaningful change. Second, run deeper reviews on a predictable schedule so weak spots don't linger. Third, share the funnel view with the people who shape the form, the tour content, and the campaign traffic, because conversion rarely breaks in one department alone.
VirtualTourEasy, GA4, GTM, and tracking pixels work best when they support one another instead of competing for credit. The teams that win with funnels are the ones that measure the actual journey, compare the right segments, and act on the result quickly. That's how more views become more leads.
If VirtualTourEasy is part of the stack, it can help teams connect immersive tours, lead capture, and analytics in one place. Visit Virtual Tour Easy to audit your current funnel, tighten the tracking around your tour experience, and plan the first A/B test before the next reporting cycle starts.