Monday morning, a new property tour is live and the dashboard looks healthy. Sessions are arriving, visitors are spending time inside the experience, and the listing page is receiving attention, yet no viewing requests have appeared. The first reaction is usually to rewrite the call to action.
That diagnosis may be wrong. A 360° tour doesn't behave like a standard landing page, because visitors don't move through it in a fixed sequence. They inspect a kitchen, rotate toward a window, open a hotspot, skip the bedroom, return later from a mobile device, and leave after finding the detail they needed. Visitor behavior analysis has to interpret those spatial choices, not count sessions and exits.
Table of Contents
- Why Tour Engagement Is Harder to Read Than a Webpage
- What Visitor Behavior Analysis Actually Means
- The Core Methods That Reveal Behavior
- A Practical Framework for Analyzing Virtual Tours
- Industry-Specific KPIs and What to Watch
- Privacy, Friction, and the Limits of the Data
- Your First 30 Days of Tour Behavior Analysis
Why Tour Engagement Is Harder to Read Than a Webpage
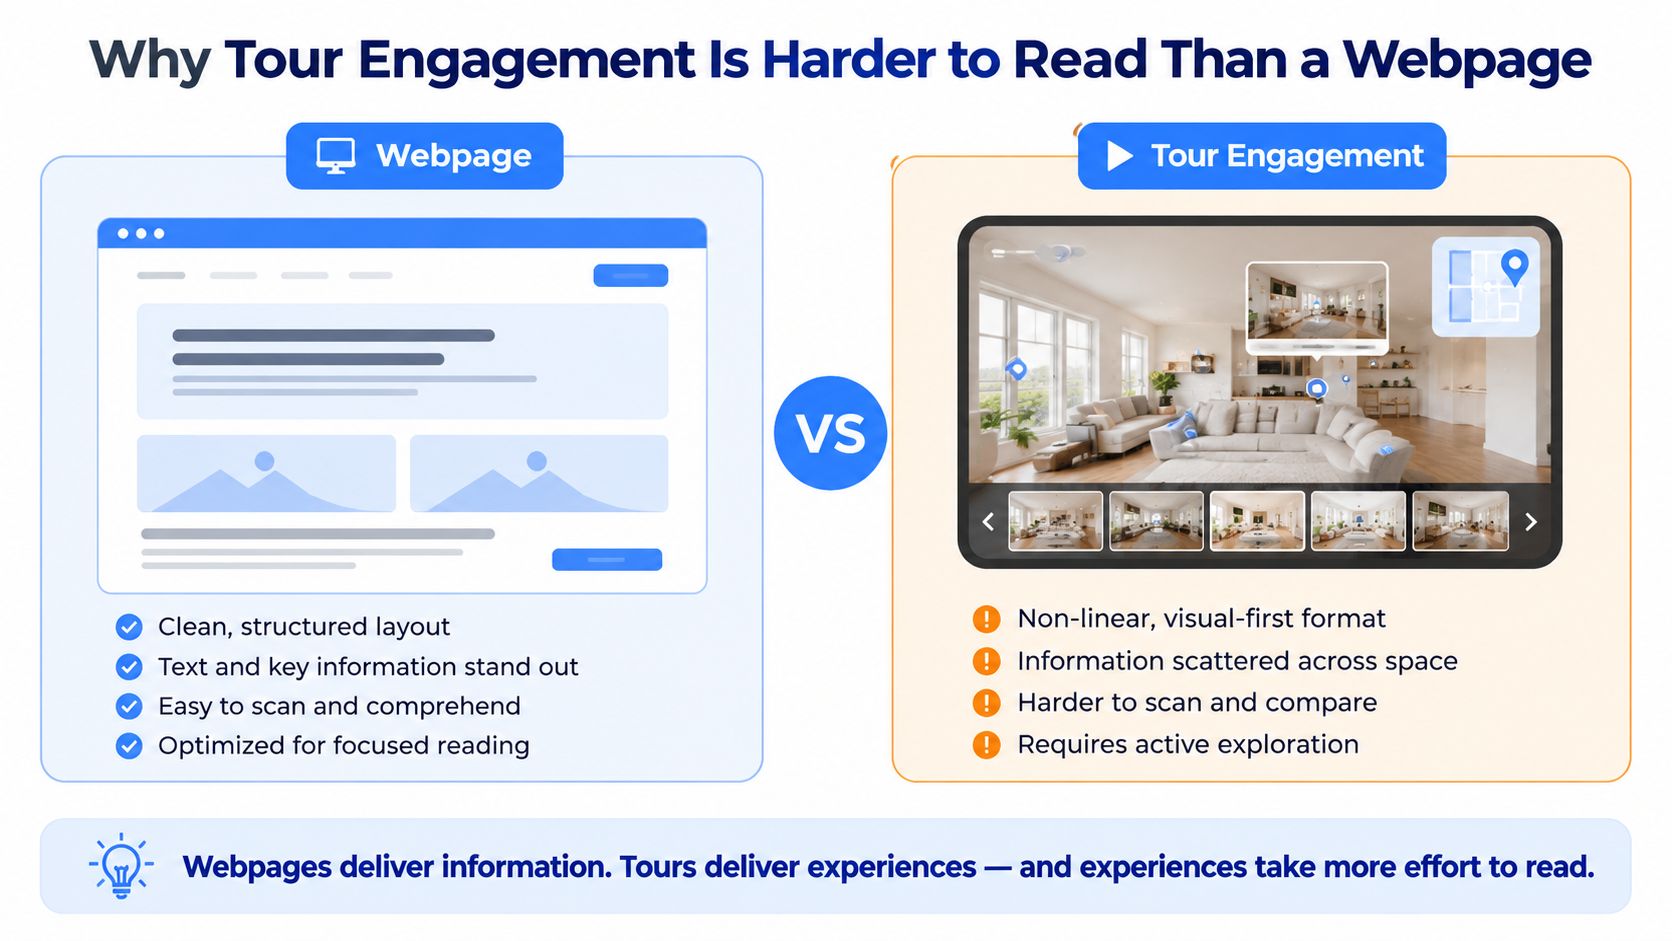
A conventional webpage offers a relatively legible path. The visitor scrolls, clicks navigation, reaches a form, or leaves. A virtual tour replaces that linear surface with a navigable environment. The visitor can remain in one panorama while changing the field of view, jumping through hotspots, or comparing rooms in an order the dashboard never anticipated.
Why standard metrics lose context
Core web analytics metrics still matter. A 2022 academic review identifies total visits, unique visitors, bounce rate, and average session duration as foundational measures, treating them respectively as frequency, reach, engagement, and duration in web analytics (VWO's overview of visitor behavior analysis). These measures establish whether an experience is attracting and holding attention, but they don't explain what happened inside a panorama.
On a webpage, an exit from a product section may indicate friction. In a tour, leaving the kitchen may mean the visitor has finished inspecting it. A short session can mean weak interest, or it can mean the visitor found the key room immediately. A long session can represent serious evaluation, casual exploration, or a technically stalled viewer.
Practical rule: Treat a tour exit as an event requiring context, not as a failed conversion by default.
Rebuild depth around space
Virtual tours don't provide ordinary scroll depth, so depth has to be reconstructed from behavior that reflects movement through the space:
- Scene order: Which panorama opened first, and which rooms followed?
- Dwell by scene: How long did the visitor remain in each room rather than in the tour overall?
- Hotspot activity: Did the visitor open floor plans, amenities, specifications, or booking prompts?
- View changes: Did the viewer rotate toward features that matter commercially?
- Return behavior: Did the visitor revisit the same zone or continue exploring elsewhere?
A useful property virtual tour guide can help teams think through the experience design before analytics are configured. The essential shift is from asking whether visitors stayed on the page to asking which spatial decisions preceded contact, comparison, or return.
What Visitor Behavior Analysis Actually Means
Traffic reporting answers a counting question. It tells a team how many sessions arrived, which source sent them, and how frequently pages or tours loaded. Visitor behavior analysis asks a harder question: what did people do, what obstacles did they encounter, and what action were they likely considering next?
The distinction resembles a store manager comparing footfall with customer behavior. Footfall establishes demand. It doesn't reveal whether shoppers examined one product, compared several, asked for help, or abandoned the visit because the checkout desk was difficult to find.
From totals to meaningful signals
The analysis becomes more useful as it moves through several layers:
- Traffic metrics establish volume and reach. Sessions, users, page views, bounce rate, and average session duration provide the baseline.
- Event signals record actions such as scene views, hotspot clicks, CTA selections, form starts, and submissions.
- Sequence analysis connects those actions into paths. It shows whether visitors move from the exterior to the kitchen, open an amenity hotspot, and then request a viewing.
- Intent interpretation examines hesitation, repetition, comparison, and return timing. These signals help distinguish casual browsing from active evaluation.
A 2023 global consumer behavior report found that 83% of shoppers across all age groups visit two or more sites before purchasing (the report published in the Journal of Information Technology and Communication). For tour operators, that means a visitor may compare multiple hotels, properties, campuses, or venues before returning through another device or channel. A first-touch report can therefore understate intent.
Spatial behavior changes the model
In a 360° experience, a visitor's path isn't only a sequence of URLs. It includes scene transitions, gaze direction, hotspot activation, field-of-view changes, and repeated inspection of a specific zone. A return to the same bedroom may be more informative than a quick tour completion, especially if the visitor then opens an inquiry form.
Longitudinal web navigation research also indicates that return timing is a distinct behavioral signal. The probability of return and the distribution of intervals between visits were found to be independent of overall user activity level (the longitudinal navigation research on arXiv). Raw visit volume alone can't describe when a visitor is likely to return.
Teams building audience-led products can find a broader treatment of turning visitor insight into action in this guide to growing a creator business. For virtual tours, the defensible output isn't a larger dashboard. It's a decision such as changing the opening scene, relocating a hotspot, qualifying a lead for follow-up, or fixing a device-specific failure.
The Core Methods That Reveal Behavior
No single method explains a tour. Each one answers a different question, and each can mislead when used without the others.
Heatmaps and attention patterns
A scene heatmap can show where visitors linger or interact inside a 360° view. That makes it useful for detecting whether people notice a fireplace, reception desk, balcony, lecture hall, or product detail. It doesn't prove that a cursor position equals visual attention, and it won't reliably explain return visits or behavior from under-sampled devices.
Trust heatmap patterns when the same spatial area attracts activity across a meaningful segment and the signal aligns with hotspot events or downstream actions. Don't use a warm region alone to justify a redesign. A visitor may move the cursor while searching, not because the feature matters.
Paths and funnels
Path analysis maps movement from scene to scene. It reveals skipped rooms, loops, premature exits, and common routes to a lead form. It misses causal intent unless the path is paired with events. A loop may represent confusion, or it may show careful comparison.
Funnels should use tour events rather than page views. A sequence such as scene viewed, hotspot opened, CTA selected, form submitted is more diagnostic than a generic page funnel. However, funnels become unreliable when different tours contain different numbers of scenes or when required steps aren't standardized.
Dwell, device, and geography
Session duration needs decomposition. A four-minute visit involving three rooms isn't equivalent to a four-minute visit across twelve rooms. Per-scene dwell, transitions per session, and hotspot activity make the total interpretable.
Device and geography splits expose delivery problems and audience differences. Mobile visitors may skim or encounter interaction friction, while desktop visitors may inspect more carefully. Geographic traffic can also behave differently because of language, loading conditions, or campaign intent. For practical conversion guidance that complements this analysis, teams can review Chatgrow's conversion guide for SMBs.
| Method | What It Reveals | What It Misses | When To Trust It |
|---|---|---|---|
| Scene heatmap | Attention and interaction zones | Causality, gaze certainty, repeat timing | When patterns align with events and segments |
| Path analysis | Room order, skips, loops | Motivation behind movement | When paired with hotspot and CTA events |
| Event funnel | Progress toward inquiry or booking | Untracked actions and inconsistent tour structures | When event names and tour steps are standardized |
| Per-scene dwell | Inspection depth by room | Why a visitor stayed or stalled | When technical load time is separated from viewing time |
| Device split | Mobile, desktop, and headset differences | Visitor intent by itself | When sample quality and rendering conditions are checked |
| Geographic split | Market-specific engagement and delivery | Individual motivation | When used for diagnosis, not personal inference |
A clean implementation often starts with a documented Google Tag Manager setup for virtual tour tracking. The implementation matters more than the visual polish of the report.
A Practical Framework for Analyzing Virtual Tours
A useful dashboard starts with a question, not a chart. The following workflow gives real estate, hospitality, education, and design teams a repeatable way to move from tour activity to a tested change.
1. Instrument the experience
Create an event taxonomy before collecting data. Each event should identify the tour, scene, hotspot, CTA, device class, and outcome where appropriate. Names such as scene_view, hotspot_open, schedule_click, and lead_submit are easier to audit than vague labels like interaction.
VirtualTourEasy can connect with GA4, Google Tag Manager, and tracking pixels without requiring changes to the tour code. Teams using another platform should apply the same principle: event payloads must preserve the spatial context needed for analysis.
2. Map the journey
Build a journey view around meaningful transitions. For a property, that may be entry scene to kitchen, kitchen to primary bedroom, bedroom to inquiry. For a hotel, it may be lobby to room type, room type to amenities, and amenities to booking.
Avoid treating every scene as a required funnel step. A tour is exploratory, so the journey model should distinguish expected routes, optional rooms, and meaningful actions.
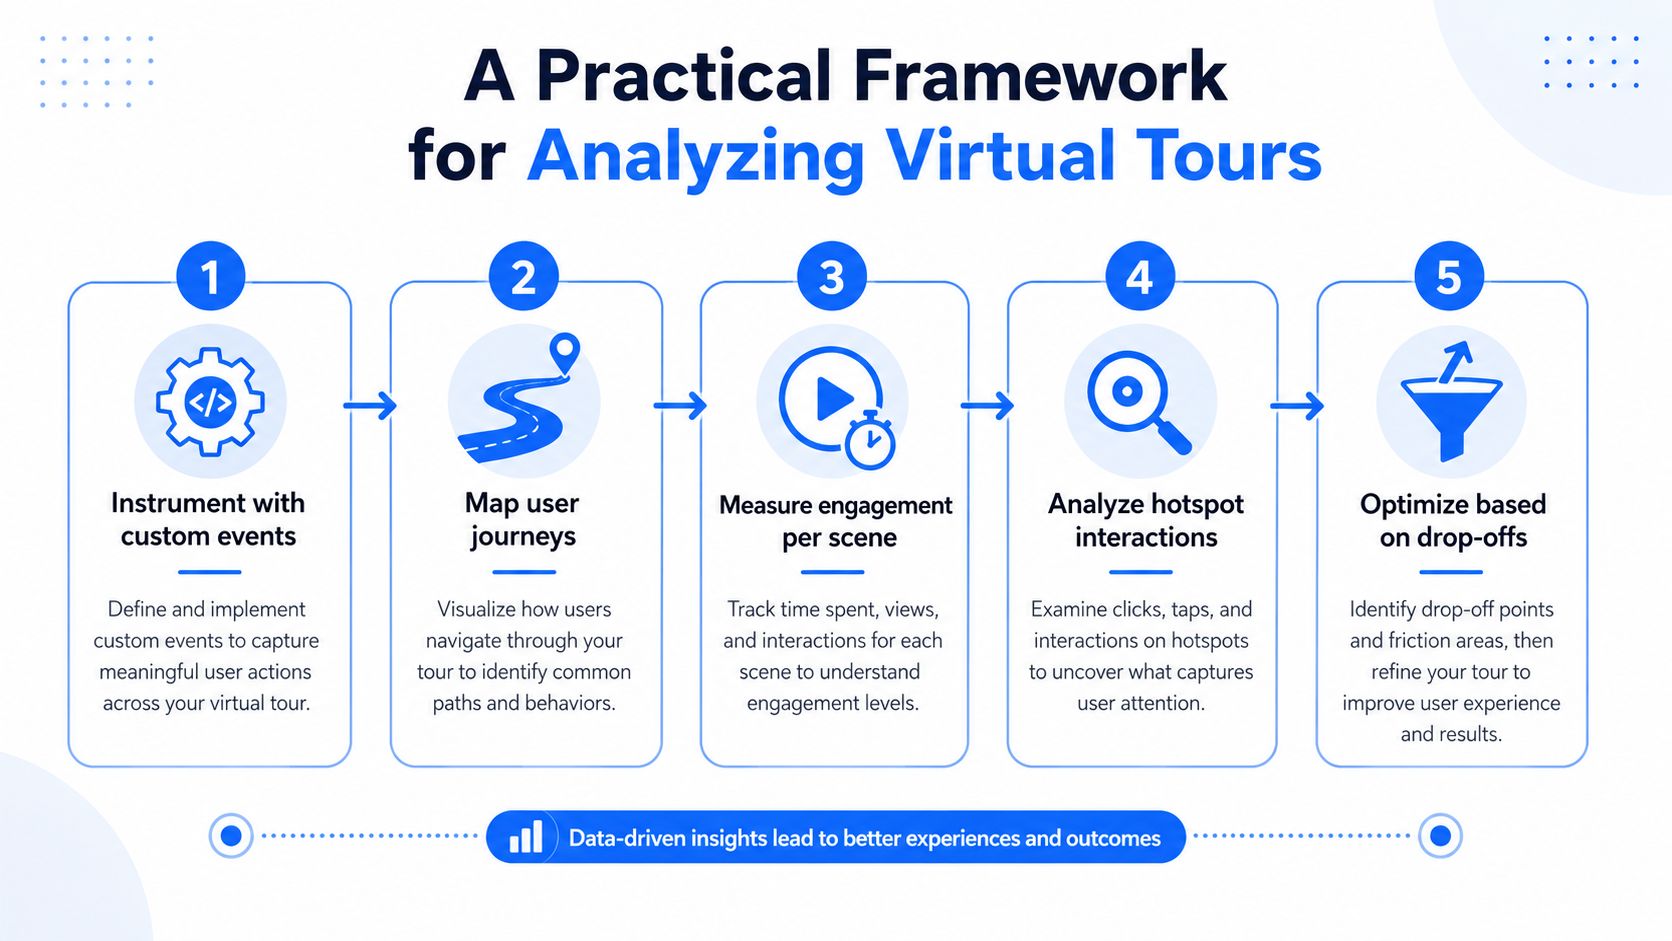
3. Measure engagement per scene
Track scene dwell, scene exits, transitions, hotspot opens, and CTA exposure separately. A total session duration dashboard can hide the difference between concentrated inspection and rapid skipping.
A scene with high dwell and low hotspot activity may need clearer navigation. A scene with low dwell and frequent exits may have a loading or orientation problem. The interpretation depends on device, entry source, and whether visitors reached the scene directly.
4. Analyze hotspot interactions
Hotspots should be treated as content choices. Record which ones open, whether visitors continue after opening them, and whether the interaction precedes a lead action. A financial-aid hotspot, floor-plan hotspot, or room-amenity panel may attract attention but still fail if the content doesn't answer the visitor's question.
5. Optimize based on evidence
Each sprint needs one hypothesis and one small change. For example, a team might test whether mobile visitors abandon the kitchen because pinch-zoom makes the scene difficult to inspect. The test could alter the starting view, add orientation guidance, or move the most important detail into a hotspot, then compare the relevant segment with its prior baseline.
Measurement discipline: A dashboard identifies a pattern. A controlled change tests whether the pattern is actionable.
Weekly reviews should end with a concrete deliverable, such as a revised scene order, new hotspot copy, a changed thumbnail, or a technical fix. Teams needing a deeper method for connecting tour actions to outcomes can use this conversion funnel analysis resource.
Industry-Specific KPIs and What to Watch
The same tour event can carry different meaning across industries. A repeated bedroom view is a potential buying signal in real estate. A repeated room-type view in hospitality may indicate comparison between stay options. The KPI has to match the commercial decision.
Real estate
The primary measure is tour-to-inquiry rate, supported by repeat views of high-value rooms and the split between agent referrals and organic visitors. A high number of scene views with little inquiry activity may point to weak qualification content, an unclear next step, or a mismatch between the listing promise and the space.
The triggered decision is often a sales follow-up rather than a redesign. A lead who repeatedly inspects the primary bedroom and opens the floor plan may deserve a more specific agent response than a visitor who only views the entry scene.
Hospitality
Hotels should watch the share of tour-engaged visitors who proceed to direct booking activity. Diagnostic signals include drop-off by room type and revisit patterns around amenities, dining areas, or event spaces.
A room scene with strong attention but weak booking progression may need clearer rate context or a more visible booking route. A revisit to several room types can indicate comparison, so the response may be a content rewrite that clarifies differences rather than an immediate interface change.
Education
For schools and universities, the primary KPI can be tour completion by prospective-student segment. Diagnostic metrics include hotspot engagement on financial-aid content and the completion gap between mobile and desktop visitors.
If prospective students reach academic spaces but ignore financial-aid information, the institution might rewrite the hotspot content or move it earlier in the journey. If mobile completion lags sharply, technical and orientation checks should come before content changes.
Architecture
Architecture studios can prioritize stakeholder presentation dwell time. Annotation engagement and specification-sheet downloads provide the diagnostic layer.
A project scene with long dwell and repeated annotations may be ready for a structured presentation follow-up. Low interaction with specifications could trigger a document rewrite or a more visible materials hotspot.
| Industry | Primary KPI | Diagnostic Metric | Triggered Decision |
|---|---|---|---|
| Real estate | Tour-to-inquiry rate | Repeat room views and referral split | Sales follow-up or scene redesign |
| Hospitality | Tour-to-direct-booking share | Room-type exits and amenity revisits | Booking-path change or content rewrite |
| Education | Completion by prospect segment | Financial-aid hotspot use and device gap | Hotspot rewrite or mobile fix |
| Architecture | Stakeholder presentation dwell | Annotation use and specification downloads | Presentation follow-up or document revision |
Privacy, Friction, and the Limits of the Data
More data isn't automatically better analysis. A tour can expose sensitive context through precise geography, viewing patterns, property details, or identifiable lead behavior. Collection should match a declared business purpose, use consent controls where required, and avoid retaining information that the team can't justify.
Privacy-friendly measurement is becoming more important as GDPR, CCPA, browser defaults, first-party data practices, and real user monitoring reshape analytics. Recent guidance emphasizes privacy-safe tracking, open-source analytics, and first-party approaches rather than indiscriminate collection (Swetrix's site insights guidance).
Friction can imitate low intent
A dashboard may label an exit as disinterest when the viewer encountered a technical failure. Common causes include autoplay blocking, WebGL problems on older mobile hardware, slow panorama loading, and abandonment of a headset experience. These failures need error events and device context, not a new CTA.
A 2025 benchmark covering 14 billion sessions reported that scroll depth fell from 75% in 2024 to 67% in 2025, mobile bounce rate changed from 54% to 48.04%, and mobile exits caused by errors increased 254% year over year (FullStory's 2025 benchmark report). Those figures describe broader digital experiences rather than every virtual tour, but they reinforce the need to separate friction from intent.
Privacy-first practice: Collect the smallest event set that can answer the business question, then validate the experience technically before interpreting abandonment.
Tour programs also need a multi-session view. The global comparison behavior noted earlier means a single-session funnel can undercount consideration, particularly when visitors compare properties or return after discussing a venue with colleagues. Use consented first-party identifiers or CRM connections where appropriate, and document exactly how identity stitching works. The platform's privacy terms should be reviewed before deployment, including Virtual Tour Easy's privacy policy.
Your First 30 Days of Tour Behavior Analysis
A new analytics program should produce decisions quickly without pretending that the first dashboard is complete. The first month is best treated as an instrumentation and diagnosis cycle.
Week 1 establishes trustworthy events
Configure scene views, hotspot opens, CTA clicks, form starts, form submissions, errors, and tour exits in GA4. Test each event through real-time reporting, then compare the analytics stream with manual actions inside the tour.
The deliverable is a short event dictionary. It should state the event name, trigger, parameters, owner, and intended decision. If the team can't explain an event in one sentence, it probably isn't ready for reporting.
Week 2 adds useful segmentation
Create views by traffic source, device class, geography, property or program, and new versus returning visitors. Capture baseline values for visits, unique visitors, bounce rate, session duration, scene dwell, hotspot activity, and lead actions. The baseline is a reference point, not a performance promise.
Week 3 turns patterns into hypotheses
Choose two or three questions, such as:
- Mobile orientation: Do mobile visitors leave before reaching the most important room because the starting view is unclear?
- Hotspot value: Do visitors who open amenity or floor-plan hotspots advance more often than visitors who don't?
- Entry source: Does paid traffic enter through a scene that matches the campaign promise?
For each question, specify the event data required, the segment being examined, the change to test, and the decision threshold. The threshold can be directional and operational, such as whether the change improves progression without increasing error exits.
Week 4 applies the fixes
Test hotspot placement, entry scenes, starting views, copy, and form exposure. Don't change several unrelated elements at once. Record the result, archive the old configuration, and schedule the next review around the strongest unresolved signal.
| Signal Observed | Likely Root Cause | Action to Test |
|---|---|---|
| High overall duration, low scene coverage | Visitors stall in one room or encounter orientation friction | Improve starting view and navigation cues |
| Strong scene views, weak hotspot opens | Features aren't discoverable or labels lack relevance | Relocate hotspots and rewrite labels |
| Form starts, few submissions | Form friction or weak value explanation | Simplify fields and clarify the next step |
| Mobile exits cluster around one scene | Rendering, loading, or zoom problem | Test the scene on target mobile devices |
| Repeat visits without inquiry | Comparison or missing decision information | Add floor plans, specifications, or clearer contact paths |
| High error exits | Technical failure rather than low intent | Review rendering, loading, autoplay, and browser logs |
A healthy program produces a small set of trusted events, stable segment definitions, and a weekly list of changes tied to observed behavior. It needs recalibration when teams debate dashboard labels, find inconsistent event counts, or keep changing the tour without recording the hypothesis and outcome.
Virtual Tour Easy supports 360° tour creation with scenes, hotspots, info panels, audio, custom starting views, lead forms, and analytics for views, visitors, devices, and geography. Teams can connect GA4 or GTM to analyze interactions, then turn verified behavior signals into practical tour changes. Visit Virtual Tour Easy to create a tour and establish a measurable starting point for the next optimization sprint.