A property manager can watch a virtual tour attract steady attention and still struggle to answer basic business questions. Which room keeps visitors exploring? Which hotspot creates enough interest to prompt an inquiry? Are people viewing from a nearby market, browsing on mobile, or returning after a sales conversation? Does the tour contribute to a booking, application, event request, or signed project?
Effective data collection strategies connect those questions to decisions. They combine behavioral, qualitative, geographic, technical, and conversion signals instead of treating every view as equally meaningful. That distinction matters because response rate and participation have always shaped the reliability of collected information, and the U.S. Bureau of Labor Statistics explains how response rates measure participation among eligible cases. Digital tours add another layer, since the operator can observe interactions without interrupting the visitor.
VirtualTourEasy analytics, lead forms, Google Analytics 4, Google Tag Manager, and tracking pixels can work together as a practical measurement system. Native tour data shows what visitors do, while forms and feedback explain what they want, and conversion tracking connects activity to outcomes. Consent, transparent disclosures, and data minimization must guide every implementation. The result should help operators convert viewers into clients, not create a larger collection of disconnected metrics.
Table of Contents
- 1. Analytics and User Behavior Tracking
- 2. Lead Capture Forms and Contact Collection
- 3. Geolocation and Regional Performance Data
- 4. Device and Platform Usage Analytics
- 5. Visitor Segmentation and Audience Profiling
- 6. Conversion and Attribution Tracking
- 7. Temporal Analysis and Viewing Patterns
- 8. Content Engagement and Interaction Heat Mapping
- 9. Feedback and Survey Data Collection
- 10. Competitive Analysis and Benchmarking Data
- Data Collection Strategies: 10-Point Comparison
- Build a Measurement Loop, Not a Data Pile
1. Analytics and User Behavior Tracking
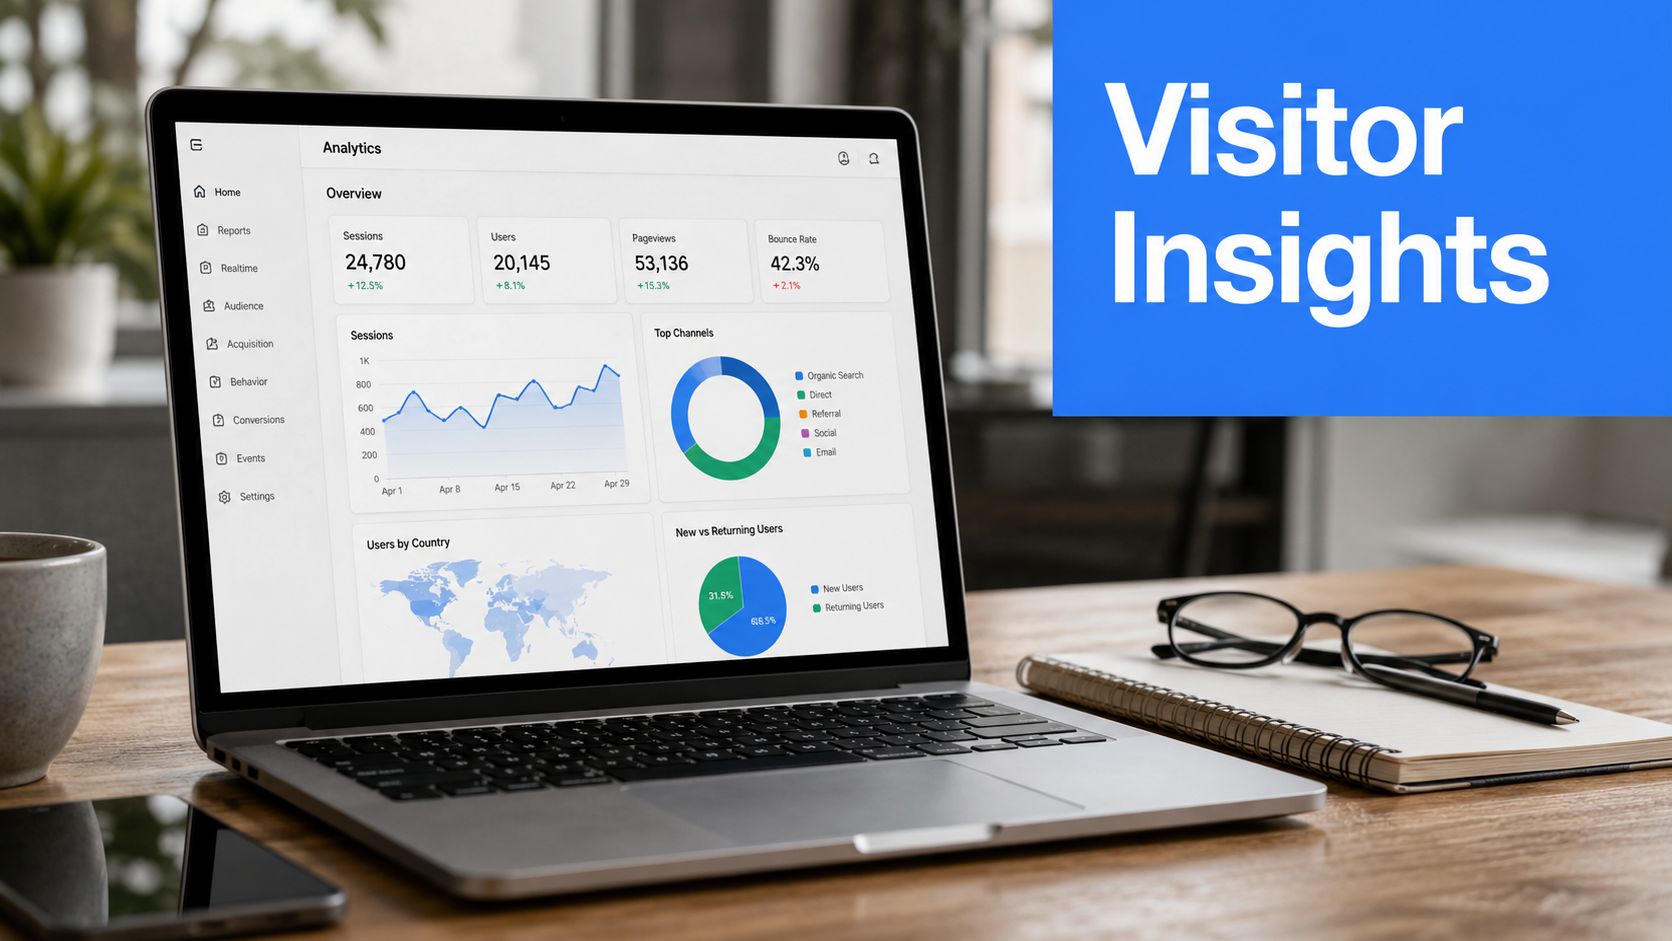
A virtual tour becomes more useful when operators can see how visitors move through it. Views, visitors, session duration, hotspot clicks, scene transitions, and navigation paths can reveal whether the experience supports the decision a business needs to influence.
A real estate agency might discover that visitors repeatedly inspect the kitchen, parking area, and primary bedroom. A hotel could find that room amenities attract more interaction than lobby scenes. An architecture studio may learn that clients spend time with material, lighting, or floor-plan hotspots. Those observations help teams improve the tour itself, rather than guessing which content matters.
VirtualTourEasy provides tour-level analytics, and its visitor behavior analysis guidance can help operators interpret interaction patterns more carefully.
Build a behavior workflow
- Define the decision: Decide whether the tour should improve navigation, increase inquiries, support bookings, or qualify prospects.
- Name the signals: Track scene views, hotspot interactions, engagement duration, device type, and traffic source.
- Compare meaningful groups: Separate mobile and desktop behavior, campaign traffic and organic traffic, or new and returning visitors.
- Make one change: Move an important hotspot, simplify a scene, revise a label, or strengthen a call to action.
- Review the next pattern: Look for directional evidence over time, not a reaction to a single visitor.
A college can use this workflow to identify whether prospective students reach academic facilities and residence spaces before opening an inquiry form. Analytics doesn't prove why a visitor behaves differently, so teams should pair it with feedback or form responses before making major content decisions.
Practical rule: A metric becomes useful only when someone can state which decision it will change.
2. Lead Capture Forms and Contact Collection
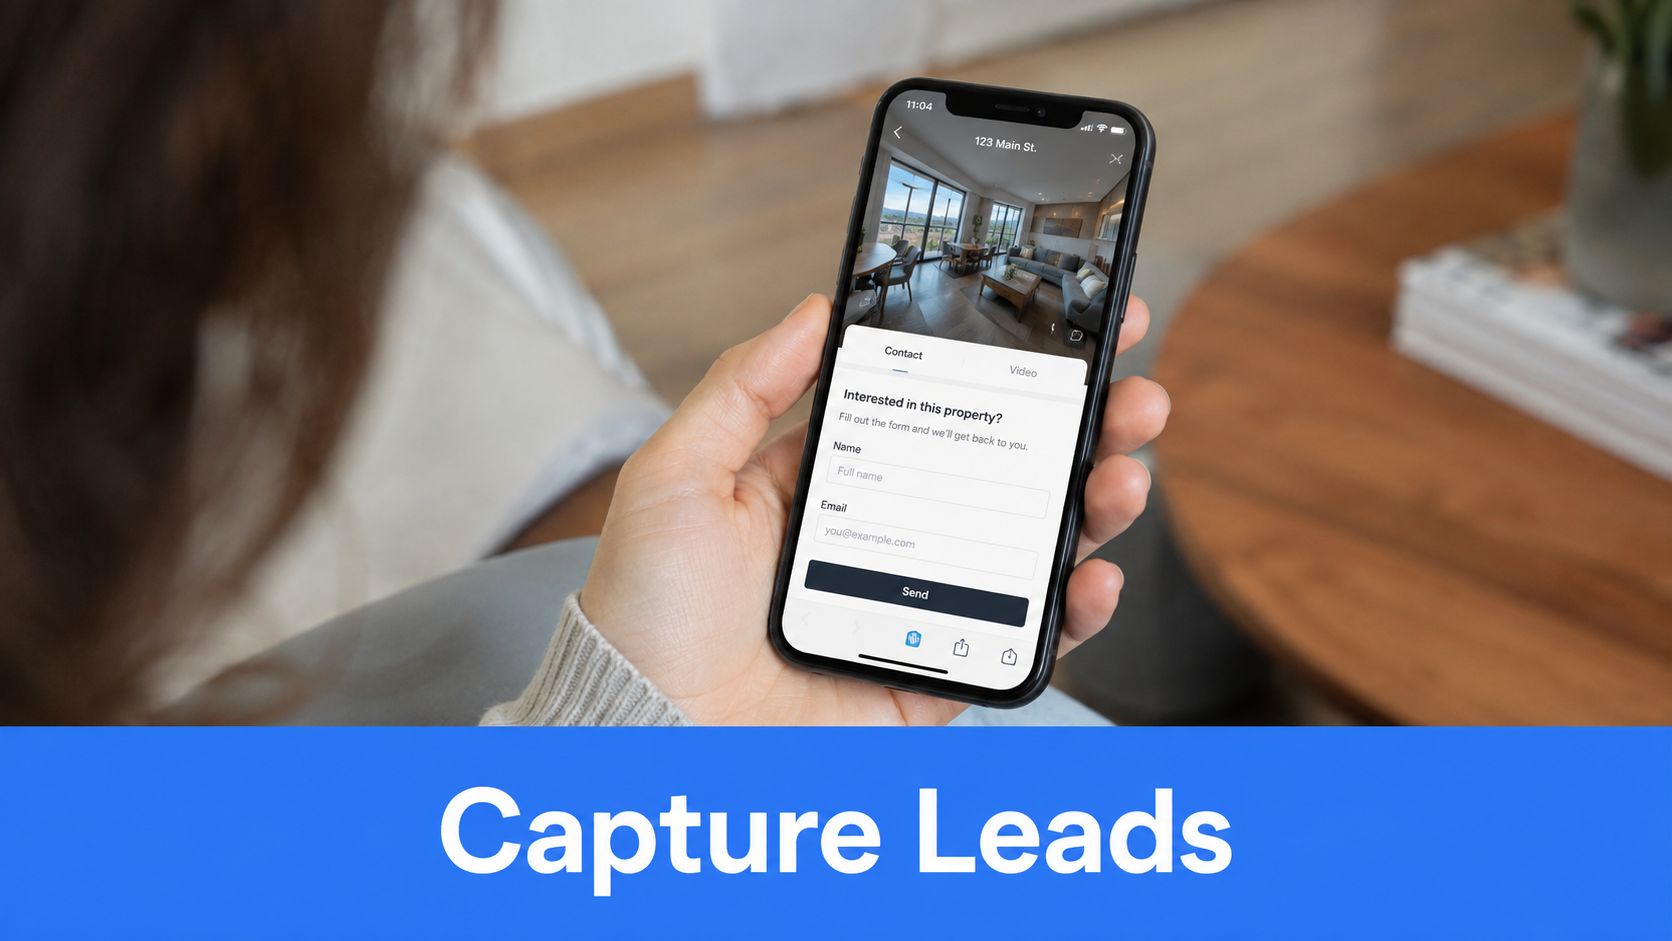
Behavioral analytics shows interest, but a lead form can turn that interest into an identifiable business conversation. The timing and wording matter more than placing a form at the tour entrance.
A property operator might present an inquiry form after the visitor explores the living areas and asks whether the home is still available. A hotel can request an event date, guest count, and preferred space after the visitor views the venue. A university can ask for a prospective student's program interest after the campus tour reaches the relevant facilities. A restaurant can collect event requirements after showing dining rooms, private areas, and service access.
VirtualTourEasy supports embedded lead forms for collecting contact details and messages inside a tour. The lead capture form documentation provides a useful reference for planning the experience.
Ask for information at the right moment
Forms should request only what the next business action requires. A sales team that needs to schedule a property conversation may need a name, email address, and preferred contact method. An event venue may need an event date and approximate requirements. More fields create more data, but they can also create more hesitation and abandonment.
A useful workflow looks like this:
- Place the form after evidence of interest: Use a relevant scene or hotspot as the transition point.
- Explain the exchange: Tell visitors whether the form will provide availability, pricing, a brochure, or a personal response.
- Use conditional questions: Ask different questions of a buyer, event organizer, student, or hospitality guest when the platform supports that logic.
- Review mobile presentation: Check field size, keyboard behavior, loading speed, and the visibility of the submit action.
- Route submissions quickly: Connect the response to the team responsible for follow-up, rather than leaving it in an isolated inbox.
Progressive profiling can collect additional preferences during later interactions, but only when each new field has a clear purpose. A form shouldn't become a disguised research questionnaire.
3. Geolocation and Regional Performance Data
A virtual tour can reveal interest beyond the physical location of a property or venue. Geographic data helps an operator distinguish local browsing from relocation demand, international research, or emerging market interest.
A hotel group might notice that visitors from several countries are exploring its event spaces. A university may see prospective students arriving from regions that aren't receiving much marketing attention. A real estate brokerage could identify relocation interest from another city and adjust its content around commuting, neighborhood access, and remote buying. An architecture firm may discover that international visitors repeatedly view a portfolio without submitting a local inquiry.
VirtualTourEasy's geo-analytics can provide location insights at country, region, and city levels. That information supports targeting, but it shouldn't be treated as a complete profile of a visitor. Location can be imprecise, shared, masked, or affected by network configuration.
Turn location into an operating decision
Start by connecting regions to actions:
- Compare acquisition sources: Review regional tour activity alongside the campaign, referral, or partner that sent visitors.
- Adapt follow-up timing: Schedule outreach around the visitor's likely business hours, while respecting consent and not inferring personal identity.
- Localize the experience: Adjust language, contact routes, availability information, or market-specific details for a relevant audience.
- Investigate weak regions: Low engagement may reflect poor localization, slow delivery, unsuitable content, or limited demand.
- Separate interest from revenue: A region that generates many views isn't automatically a region that produces qualified inquiries.
For a hospitality operator, the practical workflow might be to identify high-interest regions, review which scenes those visitors use, create a customized landing page, and then measure inquiries rather than celebrating geographic reach alone. Data collection strategies work best when location changes a budget, message, schedule, or service decision.
4. Device and Platform Usage Analytics
A tour that looks excellent on a large monitor may feel difficult to use on a phone. Device, browser, platform, and connection information tells operators where the experience succeeds and where technical friction may block a decision.
A real estate agent may find that prospective buyers first browse listings on mobile during a commute, then return on desktop for a deeper review. A hotel marketer may see visitors using tablets while comparing rooms with family members. An architecture practice might discover that a small but strategically important audience explores projects through VR hardware. A restaurant could learn that most venue inquiries begin on phones, making touch controls and fast loading essential.
Match improvements to observed friction
Device data should lead to testing, not assumptions. Operators can:
- Test common combinations: Check the tour on current phones, tablets, desktops, browsers, and relevant VR environments.
- Inspect interaction controls: Make sure hotspots are easy to tap and that labels don't overlap important visual content.
- Review media delivery: Reduce unnecessary image, video, or audio weight when loading delays interrupt exploration.
- Compare completion behavior: If mobile visitors exit before reaching a key scene, inspect navigation and page performance before changing the sales message.
- Use device-specific guidance: A clear note can direct visitors to a larger screen when detailed floor plans or design work requires it.
An interior design studio can use this workflow to preserve high-resolution detail for desktop viewers while keeping the mobile version focused on key materials, room sequences, and inquiry actions. Device analytics doesn't tell the team whether a visitor liked the design. It tells the team whether the visitor had a fair opportunity to experience it.
The trade-off is straightforward. Collecting more technical detail can improve diagnosis, but unnecessary technical data adds governance work. Keep the fields connected to accessibility, performance, and experience decisions.
5. Visitor Segmentation and Audience Profiling
The same tour can serve different audiences with different intentions. A buyer may look for condition and layout, a hotel planner may need capacity and access information, and a university prospect may care about student life, academic facilities, and support services. Segmentation makes those differences visible.
A brokerage can separate residential buyers from commercial prospects based on declared interests and tour behavior. A hotel can distinguish leisure researchers from business or event visitors using form answers and scene interactions. A university can identify visitors who reach several relevant scenes and then request program information. An architecture studio can group prospects by project type, such as residential, commercial, or hospitality work.
Start with useful distinctions
A practical segmentation workflow combines observed behavior with information the visitor intentionally provides:
- Choose a small starting set: Use a few operationally meaningful groups, such as buyer, renter, event planner, student, or design client.
- Define observable signals: Record relevant scenes, hotspot interactions, referral source, device context, and form answers.
- Assign a next action: Give each segment a suitable email, sales route, brochure, appointment type, or content experience.
- Check the segment's value: Compare inquiry quality and downstream outcomes, not just engagement.
- Document the logic: Sales and marketing teams should know why a visitor belongs to a segment and what the team will do next.
Treat a segment as a working hypothesis, not a permanent identity.
Behavior can suggest interest, but it doesn't establish demographics, personal circumstances, or intent with certainty. If a university needs to know whether someone is a student, parent, counselor, or staff member, a clear optional form question is more defensible than an unsupported inference.
Segmentation also shouldn't become a reason to collect everything. A segment that doesn't change messaging, service, or follow-up isn't earning its place in the system.
6. Conversion and Attribution Tracking
Tour engagement matters most when it can be connected to a business result. Conversion tracking links a view or interaction to an inquiry, booking, application, scheduled visit, venue request, or completed sale.
A real estate team can track a path from listing-tour visit to inquiry and showing appointment. A hotel can connect a room or event-space tour to a reservation request. A university can measure whether tour visitors submit an application. An event venue can compare tour-assisted inquiries with completed bookings. These paths often contain offline steps, so a form submission alone may not represent the final outcome.
Build a conversion path
VirtualTourEasy can connect with Google Analytics 4, Google Tag Manager, and tracking pixels. A sound implementation gives every important action a defined event name and destination.
- Mark the primary outcome: Choose the event that represents genuine business value.
- Add supporting events: Track form starts, form submissions, contact clicks, brochure requests, or appointment actions.
- Use campaign identifiers: Apply UTM parameters to distinguish paid, organic, partner, email, and social traffic.
- Record offline progress: Match calls, in-person meetings, applications, or bookings back to the originating inquiry where the organization has a lawful and reliable process.
- Review drop-off points: Find where visitors stop before the action, then improve that scene, message, form, or page.
Attribution models are useful decision tools, not objective proof that the tour caused a sale. A visitor may have encountered the brand through search, spoken with a salesperson, and then used the tour to confirm a choice. Teams should compare paths and use consistent definitions instead of assigning all credit to the final click.
7. Temporal Analysis and Viewing Patterns
Timing changes how a tour should be promoted and how quickly a team should respond. Viewing patterns can show when visitors explore, whether demand shifts with seasons, how long sessions last, and whether repeat visits precede a serious inquiry.
A real estate team may receive more property exploration during weekday evenings and schedule follow-up accordingly. A hotel may see stronger venue research around weekends and prepare event sales coverage around that pattern. A university may compare summer exploration with term-time activity to plan admissions outreach. A restaurant may notice that event-space tours rise before common planning periods and refresh availability information before interest peaks.
Connect time to staffing and content
Temporal analysis becomes practical when operators attach it to a specific workflow:
- Review by source: A paid campaign may produce a different viewing schedule from an email campaign or referral partner.
- Schedule response deliberately: Follow up when the team can answer questions, not merely when a dashboard reports activity.
- Watch repeat visits: Returning visitors may deserve a different message from first-time browsers, provided the organization handles identifiers transparently.
- Inspect exit timing: Repeated exits at the same scene can indicate confusion, weak content, slow loading, or a mismatch between visitor expectations and the tour.
- Plan seasonal revisions: Update menus, room availability, campus information, or project details when the audience's decision context changes.
A longer session isn't automatically better. A visitor may spend more time because navigation is confusing, while a qualified prospect may find the needed information quickly. Operators should interpret time alongside scene progression, form activity, and conversion behavior.
The strongest use of temporal data is operational. It helps a hotel assign inquiry coverage, helps a school plan admissions communication, and helps a property team decide when refreshed content should go live.
8. Content Engagement and Interaction Heat Mapping
A virtual tour contains many possible attention points, but visitors won't value every scene equally. Interaction heat mapping shows which hotspots, information panels, scenes, images, and videos attract attention, allowing operators to prioritize the content that supports a decision.
A property tour may reveal repeated interest in pricing, financing, condition, or storage details. A hotel can learn that event dimensions and capacity receive more clicks than decorative features. A university may find that student experience and career information drive deeper exploration. A restaurant can identify strong engagement with menus, location, private dining, and reservation instructions.
Improve the content hierarchy
The workflow should move from observation to controlled revision:
- List the high-interest elements: Identify the scenes and hotspots that attract repeated interaction.
- Check their position: Important information should be easy to find, not buried behind an unclear label.
- Review weak elements: Low interaction may indicate low relevance, poor wording, weak visibility, or technical problems.
- Test one presentation change: Adjust the hotspot label, position, format, or supporting media.
- Compare audiences: A feature ignored by general visitors may matter greatly to event planners or qualified buyers.
High interaction tells a team what visitors investigate. It doesn't automatically tell the team what visitors believe.
That distinction prevents a common error. An operator may move every frequently clicked hotspot to the opening scene, creating clutter and undermining the visual experience. A better approach is to build a content hierarchy that gives each audience the information needed at the appropriate stage.
An architecture studio can use heat mapping to decide whether material specifications belong in a prominent project scene or a supporting panel. A hospitality team can use the same evidence to refine the path from atmosphere to practical booking information. The best data collection strategies turn interaction patterns into clearer experiences, not busier ones.
9. Feedback and Survey Data Collection
Behavioral data shows what visitors do. Feedback can explain what they expected, what they couldn't find, and whether the tour changed their willingness to take the next step.
A real estate operator can ask whether the tour communicated the property's condition and layout. A hotel can ask whether the space was easy to visualize for a stay or event. A university can ask whether the experience answered questions about facilities and student life. An event venue can ask which unanswered question prevented an inquiry.
Keep the request easy to answer
A short survey works better as an interruption than a detailed research instrument. Operators can combine a rating scale with one open question, then invite a specific explanation.
- Ask after engagement: Present feedback after the visitor has explored enough of the tour to form an opinion.
- Use plain wording: Ask whether the tour helped, what information was missing, and what action the visitor considered.
- Separate experience from commercial intent: Satisfaction with navigation isn't the same as likelihood to book or inquire.
- Code recurring themes: Group open responses into issues such as missing pricing, unclear dimensions, weak navigation, or insufficient context.
- Route urgent comments: A request for availability or a personal response belongs with the sales team, not only the research archive.
The survey should make its purpose clear. Visitors are more likely to provide useful feedback when they understand how the response will improve the experience or help answer a question.
A restaurant venue can use feedback to discover that visitors like the atmosphere but need clearer information about capacity and service logistics. That insight complements hotspot data. If the venue sees repeated clicks on capacity information and receives comments requesting more operational detail, the case for a content revision becomes stronger.
Feedback can also introduce bias. The people who respond may differ from those who leave, so survey results should be read alongside behavior and conversion data rather than treated as a complete audience verdict.
10. Competitive Analysis and Benchmarking Data
Competitor tours provide context for internal analytics. A tour may attract engagement, but visitors still judge it against the alternatives they can explore from other agencies, hotels, schools, restaurants, or studios.
A real estate agent can compare how competing listings present kitchens, outdoor areas, floor plans, and property condition. A hotel marketer can review whether competing venue tours make capacity, access, layouts, and booking steps easy to understand. A university can study how peer institutions organize campus scenes and program information. A restaurant can examine how competitors communicate atmosphere, private dining, menus, and event inquiries.
Compare experiences, not vanity metrics
Operators usually can't see a competitor's internal views, conversion data, or audience composition. Competitive research should therefore focus on observable experience design:
- Map the tour structure: Record the opening scene, navigation choices, scene order, and starting view.
- Review information architecture: Note where competitors place dimensions, pricing guidance, amenities, access details, and contact actions.
- Test visitor roles: Experience the tour as a buyer, student, guest, event planner, or design client.
- Identify repeated patterns: Common features may represent audience expectations, but they aren't automatically best practice.
- Find differentiation opportunities: Look for information or service proof competitors don't communicate clearly.
- Revisit changes: Track how competitor experiences evolve, then decide which changes are relevant.
A comparison spreadsheet can help teams distinguish a missing feature from a deliberate strategic choice. The operator should combine observations with internal behavior and feedback, rather than copying a competitor's layout without evidence.
The industry benchmark data resource from VirtualTourEasy can support a more structured approach to comparison. Benchmarking is most valuable when it produces a concrete decision, such as adding a clearer capacity panel, improving the opening view, or making the inquiry path easier to find.
Data Collection Strategies: 10-Point Comparison
| Item | 🔄 Implementation Complexity | ⚡ Resource Requirements | 📊 Expected Outcomes | ⭐ Key Advantages | 💡 Quick Tip |
|---|---|---|---|---|---|
| Analytics and User Behavior Tracking | Medium, event tagging + dashboard setup | Moderate, analytics platform, tagging, analyst time | Quantitative engagement metrics and navigation patterns | Identifies high-performing scenes and hotspots | Integrate GA4 and compare tour variants |
| Lead Capture Forms and Contact Collection | Low–Medium, embed forms and CRM integration | Low, form builder, CRM, optional dev work | Collected qualified leads and contact data | Converts during high-engagement moments | Place forms after highlights; ask only essentials |
| Geolocation and Regional Performance Data | Low, enable geo reporting in analytics | Low, geo-enabled analytics; volume for significance | Regional interest, market opportunity identification | Guides localization and budget allocation | Cross-reference with marketing spend for ROI |
| Device and Platform Usage Analytics | Medium, device detection and UA tracking | Moderate, testing matrix, analytics, QA time | Device distribution and compatibility insights | Prioritizes responsive/VR development efforts | Test on common device/browser combinations |
| Visitor Segmentation and Audience Profiling | High, integrate data sources and build segments | High, CRM, analytics, data engineering, analysts | Targeted audience groups and persona development | Enables personalized follow-up and higher conversions | Start with 3–4 core segments and expand gradually |
| Conversion and Attribution Tracking | High, multi-touch setup, GTM/GA4 configuration | Moderate–High, tracking pixels, cross-domain setup | ROI measurement and conversion source attribution | Quantifies tour business impact for stakeholders | Use UTMs and define GA4 conversion goals |
| Temporal Analysis and Viewing Patterns | Low–Medium, time-series setup in analytics | Low, analytics tools and historical data | Peak viewing times, seasonal trends, session duration | Optimizes outreach timing and staffing | Schedule follow-ups based on observed peak times |
| Content Engagement and Interaction Heat Mapping | Medium–High, hotspot-level events and heatmaps | Moderate, heatmap tools, instrumentation | Granular content-level engagement metrics | Reveals which content to emphasize or remove | A/B test hotspot placement and labeling |
| Feedback and Survey Data Collection | Low, embed short surveys or prompts | Low, survey tool, small incentive, analysis time | Qualitative insights into visitor intent and pain points | Explains the "why" behind behavior metrics | Keep surveys 3–5 questions and time after ~50% completion |
| Competitive Analysis and Benchmarking Data | Medium, manual reviews and regular audits | Low–Moderate, research time, documentation | Benchmarking vs. peers and feature gap identification | Reveals industry best practices and differentiation areas | Analyze 3–5 competitors and focus on differentiation |
Build a Measurement Loop, Not a Data Pile
A useful virtual-tour measurement system starts with one business outcome. A property operator may choose qualified inquiries, a hotel may choose booking requests, a university may choose applications, a restaurant may choose event leads, and a design studio may choose consultation requests. That outcome gives every later data point a job.
The first implementation layer should be native tour analytics. VirtualTourEasy can provide views, visitors, session duration, device information, and geographic context for each tour. The operator can then connect Google Analytics 4, Google Tag Manager, or a tracking pixel to capture the important action that happens after exploration.
Next, add only the fields needed to act on the lead. A hotel may need an event date and space preference, while a school may need a program interest and contact route. A feedback prompt can supply one qualitative signal, such as the most important unanswered question. This sequence prevents teams from building a large form before they understand how visitors use the tour.
Use a disciplined review cycle
A practical loop has five stages:
- Define the outcome: Choose one result that represents business value.
- Instrument the experience: Set up analytics and the primary conversion event.
- Add context: Collect a small amount of lead or feedback information with clear purpose.
- Segment carefully: Compare meaningful differences, such as audience type, source, device, or region.
- Improve and review: Change one part of the tour, then examine behavior alongside conversions.
The best web scraping API service isn't a substitute for a well-designed first-party measurement loop. Virtual-tour operators should collect direct interaction and inquiry data that relates to their own audience and decisions. External data can provide context, but it can't replace clear definitions, consistent tracking, or direct feedback.
Maturity matters more than collection volume. A 2025 B2B marketing benchmark reports that 91% of B2B marketers collect first-party data, while 50% describe their strategy as exploratory or developing. That gap reflects a common operational problem: organizations can gather information before they have standardized capture, ownership, CRM routing, and activation.
Fragmentation creates its own risk. A 2025 report on data collection processes found that 98% of respondents using manual processes struggle with inefficiencies, 80% report accuracy or integrity problems, and 91% worry about security. Those figures support a practical priority for tour operators, connect the tour, analytics, forms, and sales workflow before adding another channel.
Privacy belongs inside the loop, not at the end of it. Teams should document consent, minimize fields, define retention periods, restrict access, and explain collection and use in transparent language. They should also recognize that response rate alone doesn't establish representativeness or eliminate nonresponse bias, as official statistical guidance makes clear. The National Academies' account of the 1990 census workflow illustrates why reliable collection depends on layered processes, including address preparation, enumeration, follow-up, processing, and evaluation.
VirtualTourEasy gives real estate teams, hotels, restaurants, schools, and design studios a practical environment for creating, sharing, measuring, and improving virtual tours. A free starting point can help an operator establish the initial workflow, while advanced plans support broader collaboration and operational needs. The right starting point remains modest: analytics, one conversion event, and one qualitative signal, followed by a privacy review and a repeatable decision cycle.
Virtual Tour Easy helps businesses create immersive tours, add hotspots and lead forms, and connect tour activity with GA4, GTM, and tracking pixels. Visit Virtual Tour Easy to build a measurement-ready tour for a property, venue, campus, restaurant, or design portfolio.