In September 2025, Midwest existing-home sales were running at an annualized pace of about 940,000 homes, while the region's median price remained $94,400 below the national median. That pairing makes Midwest real estate data more useful as a reference system than as a one-line affordability verdict: sales, prices, supply, construction, and migration each describe a different part of the market, and regional averages can conceal what's happening in individual metros. The National Association of REALTORS' September 2025 regional snapshot provides the sales and price comparison.
Read these indicators as a connected dataset, not a forecast. Long-run Federal Reserve series provide historical context; NAR reports transactions and prices; migration measures help describe movement between markets. Used together, those sources can support a consistent dashboard while keeping each number tied to its geography, time period, and definition.
Table of Contents
- What Midwest Real Estate Data Covers
- Long-Run Price Series from the Federal Reserve
- Core Sales, Price, and Supply Metrics from NAR
- Building a Midwest Real Estate Dashboard
- Metro and Migration Indicators by Market
- Why Affordable Headlines Can Hide Tight Markets
- County and Metro Data Source Lookup
- Using the Data for Real Decisions
- Quick-Reference Glossary of Midwest Housing Terms
What Midwest Real Estate Data Covers
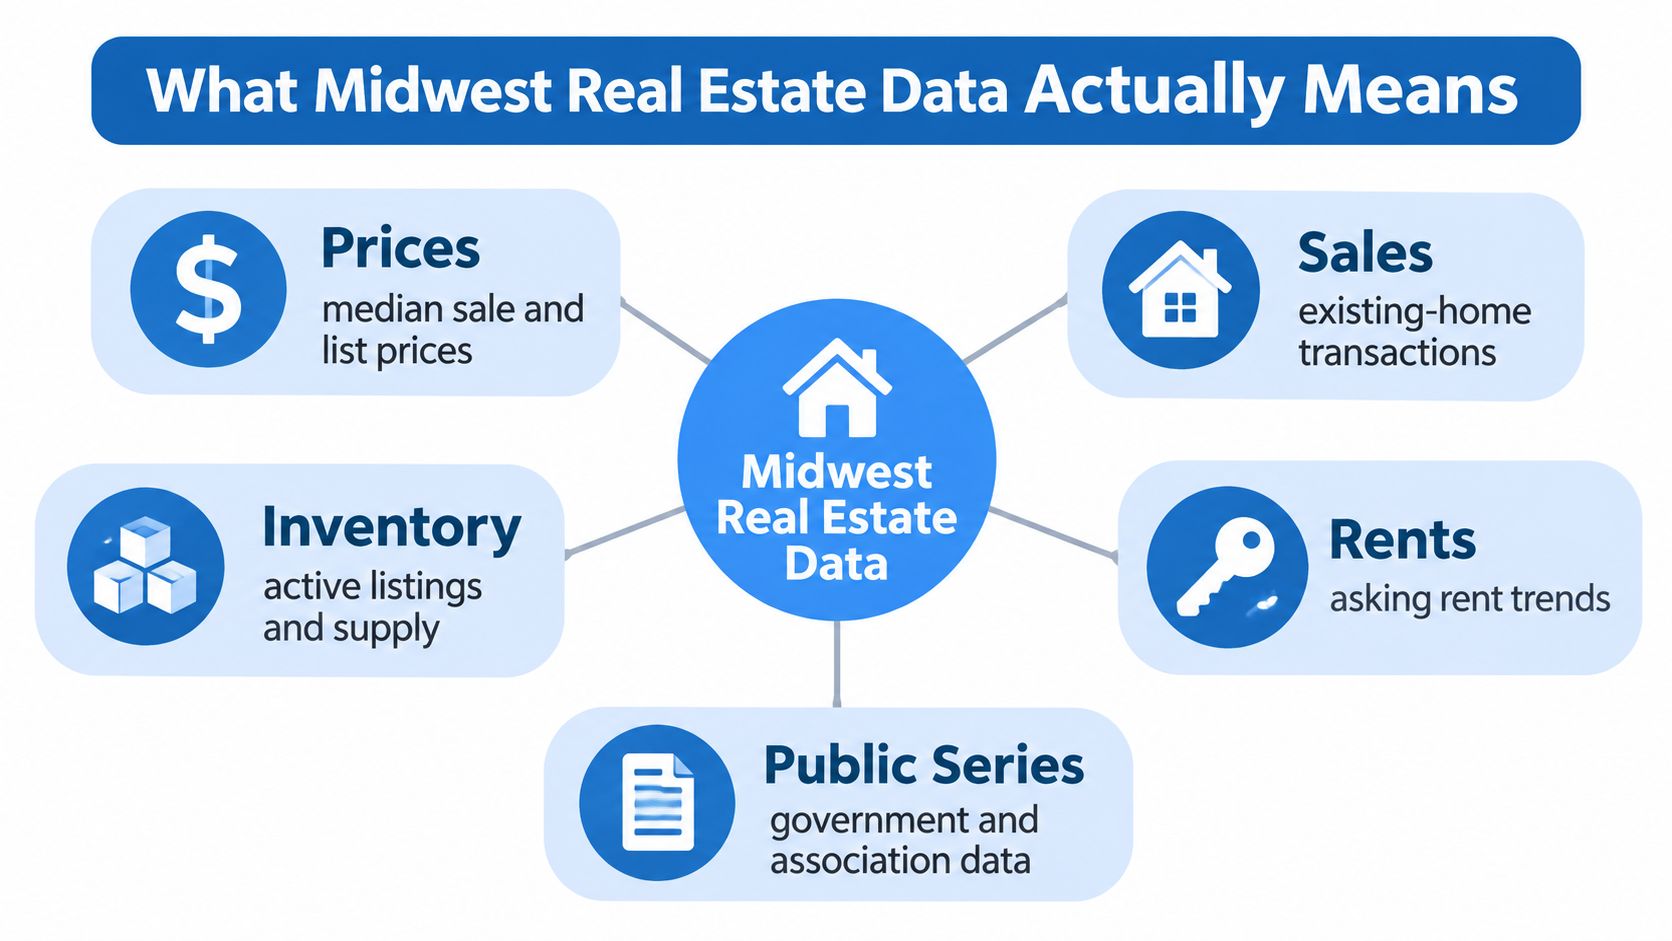
Midwest real estate data covers several distinct measures. Home prices, sales, active listings, construction, rents, and household movement each describe a different market condition. Each has its own publisher, geographic scope, frequency, and definition. A regional median sale price describes completed transactions, while a county-level home-value estimate or metro sales count answers a different question.
Geography sets the limits of any comparison. A dataset may cover the Midwest region, a metropolitan area, a county, or a smaller local market. These boundaries aren't interchangeable: a regional price measure cannot establish whether a particular county is affordable or whether a metro has adequate inventory.
Record the coverage before comparing the values.
Match the publisher to the question
The Federal Reserve Bank of St. Louis provides historical housing measures; NAR reports existing-home sales and prices. The U.S. Census Bureau publishes construction and survey data, while the Bureau of Labor Statistics supplies labor-market context. Regional MLS aggregators offer more granular listing information, although coverage and definitions vary.
The reference-work approach assigns each source a role in a decision dashboard. Construction measures describe new supply, transaction reports capture completed sales, and listings and months of supply help assess available inventory. Bank of America migration indicators can sit alongside those measures as context for household movement, without being treated as evidence of completed home purchases. A regional average can therefore serve as a benchmark while leaving local availability unresolved.
For historical reference, FRED's Midwest housing data category includes quarterly housing-price measures from Q1 1963 through Q4 2025 and monthly housing-construction data beginning as early as January 1959. Preserve each series' definition and geography when combining that history with sales or migration measures, so the dashboard remains a usable reference rather than an implied forecast.
Long-Run Price Series from the Federal Reserve
Current prices have more meaning when compared with a consistent historical measure. The Midwest series available through the Federal Reserve Bank of St. Louis extend across multiple housing cycles, including the late-1970s and early-1980s interest-rate shock, the 2000s housing boom and financial crisis, the post-2010 recovery, and the pandemic-era market. Those comparisons help analysts ask whether a recent move is unusual in historical context or part of a broader pattern.
The series are not all measuring the same thing. A dollar-denominated measure reports a value in money terms, while an index expresses change relative to a defined base. The first is more direct when examining price levels; the second can help compare the direction and scale of changes across time without treating the index value as a home's dollar price. Analysts should read the series description before making either interpretation.
Select the series to fit the decision
Frequency matters, too. Quarterly data is suited to longer-horizon price comparisons, while monthly housing-construction measures can show more frequent changes in building activity. A seasonally adjusted series is designed to make recurring calendar patterns less influential; an unadjusted series retains those patterns. Neither is universally better. The right choice depends on whether the analysis is comparing underlying movement or describing what was recorded in a particular period.
A practical selection sequence keeps the work reproducible:
- State the question. Is the task to compare long-term price movement, assess current construction, or track activity at a finer interval?
- Match the unit. Choose dollars when price level matters, or an index when relative movement is the focus.
- Match the frequency. Use quarterly measures for broad price history and monthly measures when the available series and question call for closer tracking.
- Choose the adjustment status. Keep seasonal treatment consistent across periods being compared.
- Record the series definition. Preserve the geography, unit, frequency, and adjustment status with any chart or reported result.
This discipline is especially important when a regional series is used to interpret a local market. A Midwest trend can establish context, but it can't substitute for metro-level evidence. For a more local view of how Chicago-area conditions can be examined, Melrose Park real estate market trends offers market-specific context to consider alongside the broader historical series.
Core Sales, Price, and Supply Metrics from NAR
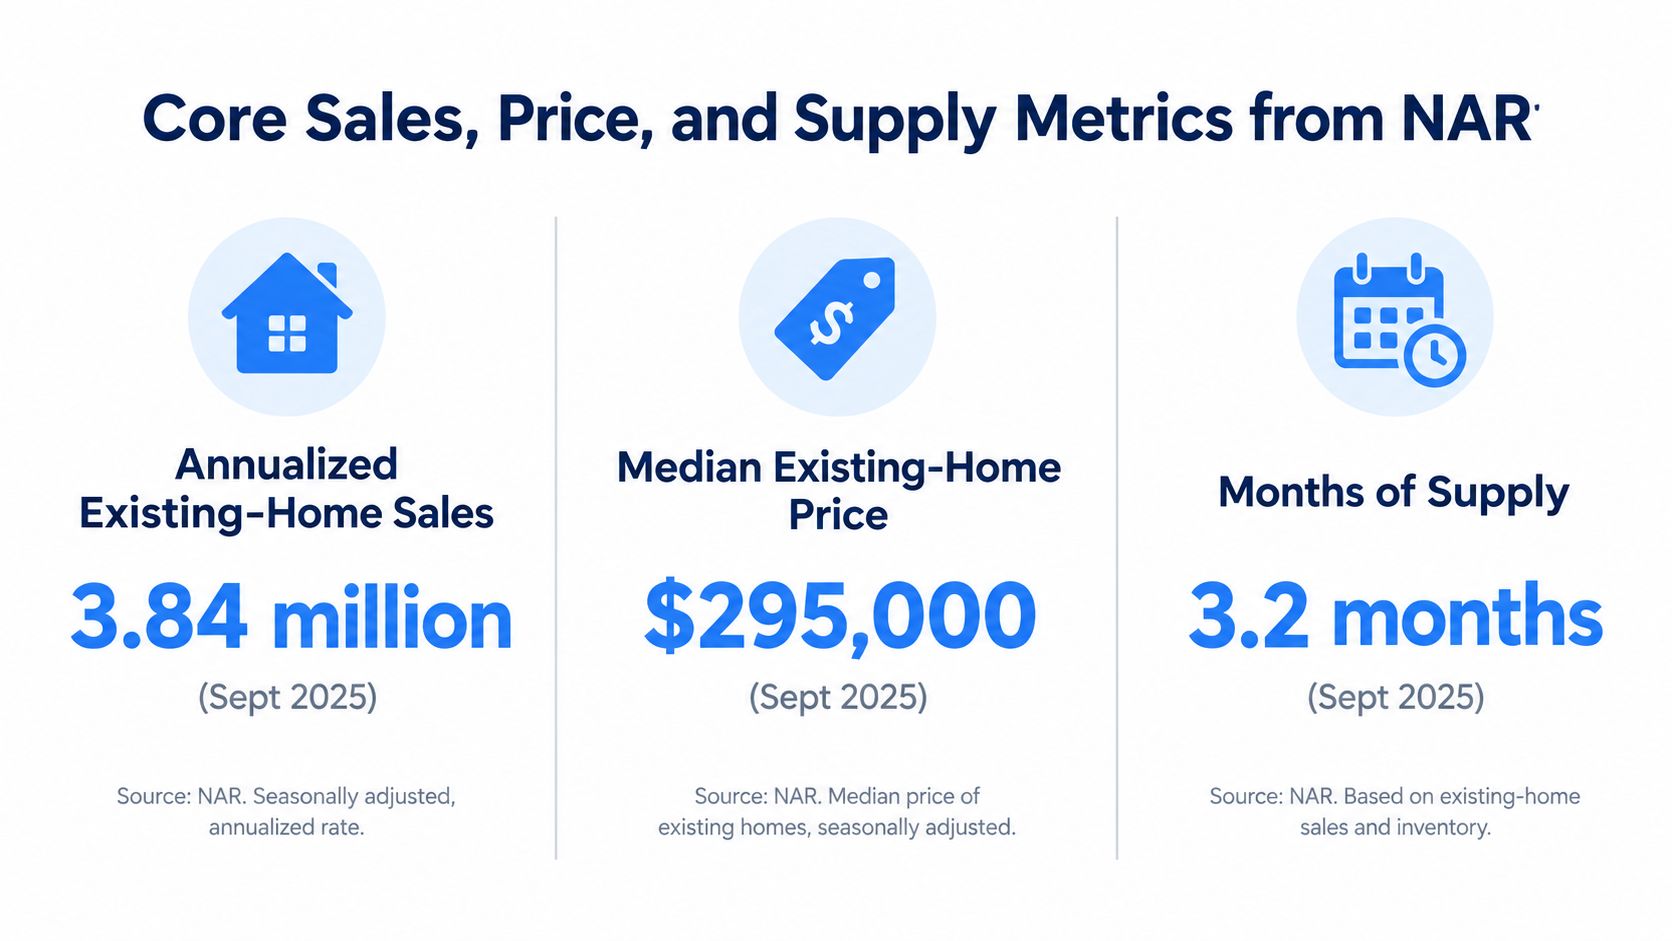
Midwest existing-home sales reached a seasonally adjusted annual rate of roughly 940,000 units in September 2025, up 2.2% year over year, while the regional median price rose 4.7% year over year to $320,800, compared with a national median of $415,200, making the Midwest $94,400 lower, or about 23% below the national figure (NAR's September 2025 existing-home sales overview).
That snapshot belongs in a reference dataset, not a forecast. It records completed transactions and their prices, providing a current-market counterpart to long-horizon FRED price series. Bank of America migration indicators can add context about population movement, but they measure a different activity and should remain separately identified.
Read the metrics together
The core measures answer distinct questions:
- Annualized existing-home sales describe transaction pace. A seasonally adjusted annual rate expresses the monthly pace on an annual basis; it is not a count of homes sold during that month.
- Median existing-home price describes the midpoint of completed-sale prices. Its movement can reflect changes in the mix of properties sold as well as changes in underlying prices.
- Months of supply relates available inventory to the sales pace, adding the stock-versus-flow perspective missing from sales and prices alone.
Rising sales alongside rising median prices therefore leave an important question unresolved: did available inventory keep pace with transactions? Without a comparable supply measure, analysts can describe activity and price levels but cannot establish whether the inventory balance tightened. A missing supply observation should remain a gap rather than become an implied conclusion.
Median is not average. A small number of luxury sales has less influence on the median than on the average, making it useful for broad regional comparisons. It still cannot describe the full price distribution or the purchasing options facing a particular household.
The Midwest aggregate also combines markets as different as Chicago, Minneapolis–St. Paul, Detroit, Columbus, and Kansas City. Retain NAR's geography and property-type definitions, and compare sales, prices, and supply for the same reporting period. Regional affordability relative to the nation is a price-level comparison, not evidence that every Midwest metro offers ample inventory.
Building a Midwest Real Estate Dashboard
A dashboard should make comparisons consistent before it makes them attractive. Each measure needs a defined input, a stable geography, and a clear comparison period. Otherwise, a change in the chart may reflect a different property mix, reporting interval, or boundary rather than a real market shift.
Start with a compact set of calculations:
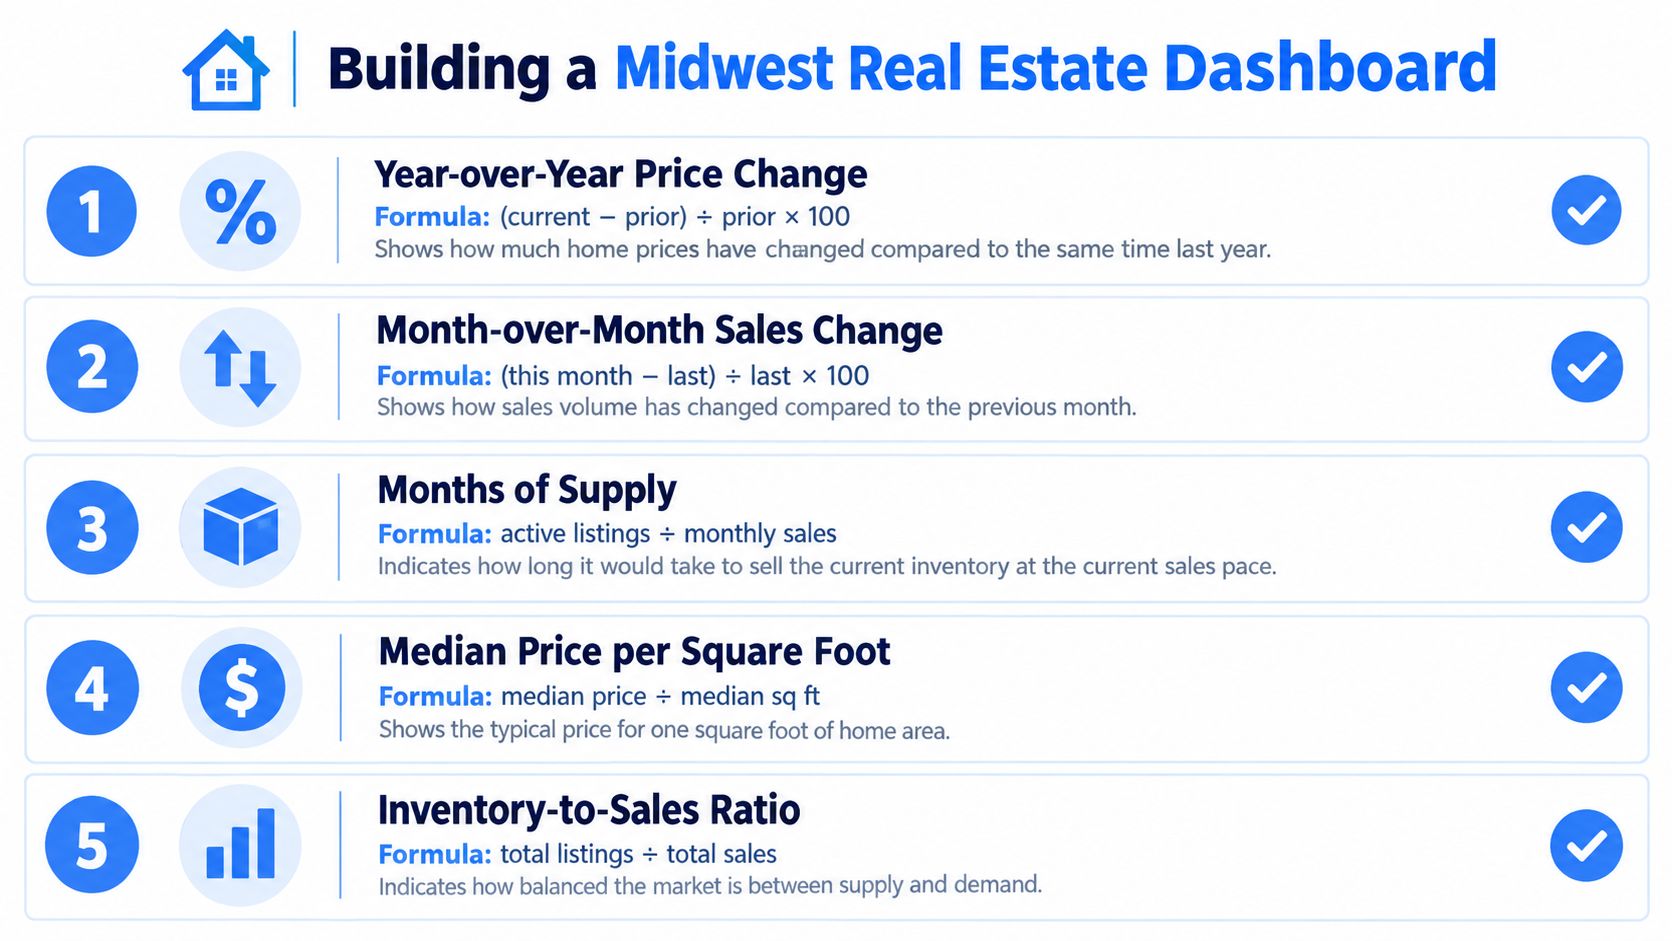
- Year-over-year price change:
(current median price − median price in the same period last year) ÷ prior-year median price × 100. Keeping the month or quarter consistent reduces seasonal distortion. - Month-over-month sales change:
(this month’s sales − last month’s sales) ÷ last month’s sales × 100. Use comparable, seasonally adjusted annual rates when the source provides them. - Months of supply:
active listings ÷ monthly sales. The result depends on using a consistent inventory count and sales measure. - Pending-sales conversion:
completed sales ÷ pending sales for a matched cohort and interval. Document the time window, because pending contracts and completed closings don't occur simultaneously. - Median days on market: the median number of days a property remains listed before the defined sale or contract event. Keep the event definition constant across markets.
Keep comparisons like-for-like
Before comparing two charts, check that they share the same geography, property type, time period, and seasonal-adjustment treatment. Use median rather than average price when the goal is a typical transaction benchmark, and label whether sales are actual monthly counts or annualized rates. These choices make a dashboard easier to audit and harder to misread.
Affordability adds a different lens. NAR describes an affordability index above 100 as indicating that a median-income family earns more than the income required to qualify for a median-priced home at prevailing mortgage rates (the affordability index explanation). It complements price and supply because it connects prevailing financing conditions with household income rather than treating the sale price alone as the full affordability test.
For teams connecting market analysis to campaigns, neighborhood pages, or listing content, real estate marketing ideas can help translate an evidence-based dashboard into relevant audience communication without changing the underlying data definitions.
Metro and Migration Indicators by Market
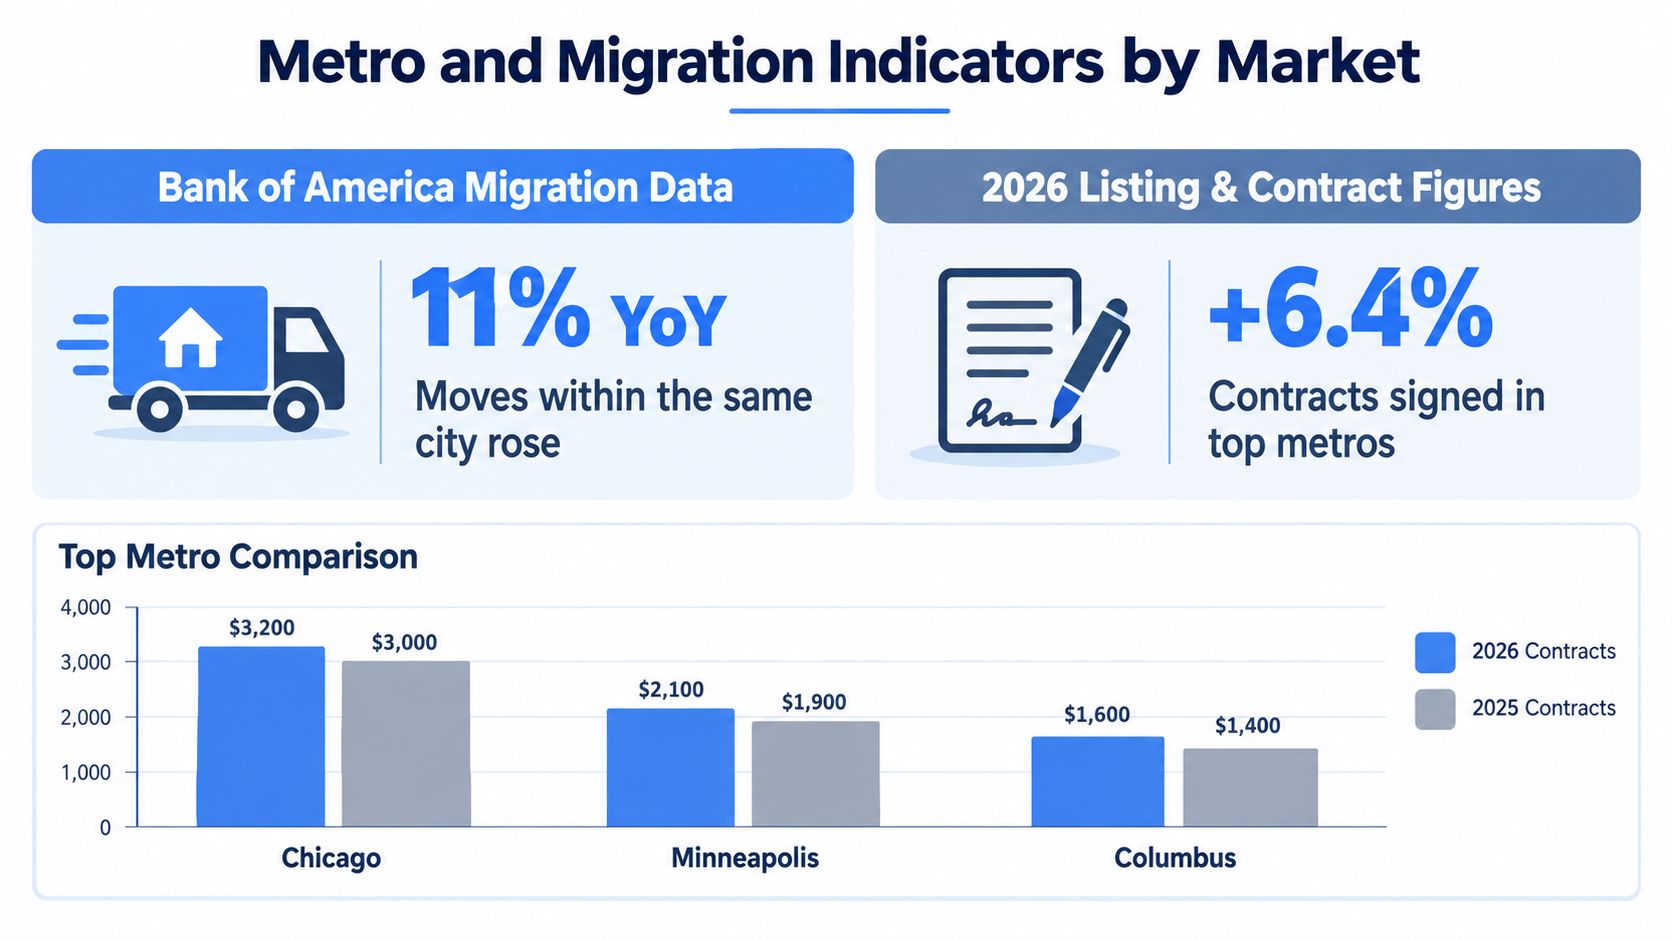
Moves within the same city rose 11% year over year, while moves to another city rose 7% in the first quarter of 2025, according to Bank of America's Q1 2025 On the Move analysis. Its account-based indicators also showed continued interest in Midwest destinations, with variation across markets. These measures describe movement among the bank's customers, so their coverage differs from housing transaction records.
Migration provides context for potential demand. A relocation can lead to renting, purchasing, or joining an existing household, which limits its usefulness as a direct measure of buyer activity. Listings and contract signings provide a more immediate view of homes entering the market and buyers committing to transactions. For Kansas City and Louisville, a numerical comparison requires a linked local report identifying the reporting period and market coverage; without that foundation, neither market should receive a growth ranking.
Separate listing growth from demand growth
Listing growth alone cannot establish easing competition.
New listings measure incoming supply, available inventory measures the stock still on the market, and contract activity tracks a stage of buyer absorption. If listings and contracts both increase, analysts need inventory levels to distinguish replenishment from accumulating unsold homes. Percentage growth also depends on the starting base, so faster contract growth does not by itself establish greater transaction volume or tighter conditions.
For Chicago, Minneapolis–St. Paul, Columbus, Indianapolis, Cincinnati, and Kansas City, the reference dashboard should connect long-horizon FRED price series with NAR sales measures and Bank of America migration indicators. Each contributes a different analytical layer: historical price context, transaction activity, and household movement. Keep their reporting periods visible rather than treating them as simultaneous observations.
Divergent indicators are useful diagnostic evidence. Rising migration alongside weak contracts warrants examining tenure choices, timing, and neighborhood or property-type differences. Regional averages can obscure those differences; retaining metro-level observations lets readers test explanations instead of converting a movement indicator into a housing forecast.
Why Affordable Headlines Can Hide Tight Markets
A lower regional median doesn't guarantee that a household can buy a home in a specific metro. In Q1 2026, the Midwest median was $308,100, up 3.6% year over year. At the same time, typical mortgage payments consumed 21.5% of family income nationally, making financing costs relevant to any affordability assessment (NAR's Q1 2026 metro price and inventory report).
Inventory figures sharpen the picture. Cleveland had about 1.2 months of inventory and Columbus about 1.3 months. Cleveland homes absorbed more than 20% of total inventory weekly, compared with roughly 12% nationally, according to the same NAR report. A market can therefore have a lower headline price and still present a constrained search, limited choice, or brisk competition.
Evaluate ownership costs, not just sale prices
The more useful question is which neighborhoods remain attainable after accounting for mortgage payments, taxes, insurance, repairs, and bidding pressure. Those costs vary by property and buyer, so a regional median can't settle the question. Nor does a regional affordability narrative reveal how quickly listings are being taken off the market in a particular price band.
A careful comparison pairs the initial price benchmark with local supply and market speed, then adds household-specific ownership costs. Where local data is available, analysts can separate results by metro, neighborhood, property age, and buyer profile. The point isn't to discard regional comparisons, but to treat them as an entry point rather than a complete affordability test.
This distinction also improves property and industry benchmarking. Real estate industry benchmark data can provide a starting point for thinking about what a metric measures, while local supply and full ownership costs determine how that metric applies to a particular market. For buyers, agents, and relocation researchers, that separation helps prevent a lower median price from being mistaken for easy access.
County and Metro Data Source Lookup
Geography determines whether a housing measure belongs in a county or metro comparison. Regional series provide historical context; metro reports support market comparisons; county datasets address local population, housing, and construction questions. Coverage varies by measure, so select the geographic unit before selecting the publisher.
The lookup below separates entry points from the underlying datasets. FRED distributes series from multiple agencies, making it useful for discovery, but researchers still need the originating agency's definitions.
| Source pathway | Useful measures | Geographic or time detail | Clickable starting point |
|---|---|---|---|
| FRED, including Census Bureau construction series and FHFA house-price measures where available | Historical housing prices and construction | Midwest series include quarterly price measures and monthly construction data; confirm coverage in each series | FRED Midwest housing category |
| National Association of REALTORS | Existing-home sales and median price | Regional reporting supports Midwest and national comparisons; confirm the reporting period inside the document | NAR September 2025 existing-home sales overview |
Verify the series before citing it
Record the series or table identifier, geographic definition, units, frequency, seasonal-adjustment status, observation period, and retrieval date. Name the specific FRED series in the analysis rather than citing a category as though it were a dataset.
For Census research, distinguish New Residential Construction releases from American Community Survey tables. Construction activity and survey-based household characteristics answer different questions. Check each table's geography and period before using it in a county profile. FRED's construction listings are a discovery route, not a substitute for locating the relevant survey table.
For FHFA measures, consult the selected House Price Index dataset and methodology. An index measures price movement under its stated definitions; it cannot replace a transaction median.
NAR supplies regional sales context, while a local MLS aggregator may provide listing detail if its coverage is documented.
Treat this lookup as a reference layer for a dashboard, not a forecast. Keep long-horizon prices, sales reports, and migration indicators separately labeled. Require county-level observations for county-level conclusions; a metro or regional total cannot establish conditions within every constituent county.
Using the Data for Real Decisions
A regional dataset earns its keep when it changes a decision. Brokers can use sales pace, local supply, and price movement to inform listing preparation and pricing conversations, then qualify leads with a clearer view of buyer conditions. For investors, transaction and construction context can help frame questions about acquisition timing, rents, and supply, but underwriting still needs property-level costs and revenue assumptions rather than regional averages alone.
Marketers can use the same framework to decide which local questions deserve targeted content. If the evidence points to constrained inventory, content can help buyers compare available neighborhoods and understand the trade-offs. If migration indicators and listings diverge, a useful message explains that difference instead of flattening the market into a single regional narrative.
Connect public indicators to property presentation
Market data describes the context around a property; it doesn't show the layout, condition, or features that a prospect needs to evaluate. A listing presentation can bridge that gap with clear photography, floor-plan information, and remote viewing options. Listing presentation for real estate offers further context on presenting a property to prospective buyers.
For a team's dashboard, the operational sequence is straightforward: identify the audience, select the relevant geography, establish the current market conditions, and connect each conclusion to a property or campaign decision. Brokers can use market speed to set expectations with sellers. Investors can separate broad trends from property-specific assumptions. Marketers can use local evidence to build more relevant landing pages and calls to action.
The key discipline is keeping the evidence and the decision at the same scale. A Midwest statistic can establish regional context, but a neighborhood campaign or property valuation needs local inputs. That's how a reference dataset supports action without pretending to forecast every market.
Quick-Reference Glossary of Midwest Housing Terms
- Seasonally adjusted annual rate (SAAR): A seasonally adjusted pace expressed as an annual rate. It helps compare the underlying pace across reporting periods, but it isn't the number of homes that sold in a single month.
- Months of supply: Active inventory divided by the monthly sales pace. It relates current listings to demand, so the inventory count and sales period must be defined consistently.
- Absorption rate: The share of available inventory that sells or goes under contract over a stated period, depending on the source's definition. A higher rate suggests faster turnover, but only when the comparison uses the same calculation.
- Median versus average sale price: The median is the middle observed sale price; the average adds all sale prices and divides by the number of transactions. The average can be more affected by unusually high or low transactions.
- Affordability index: A measure comparing household income with the income needed to qualify for a home under the methodology used. NAR describes a value above 100 as indicating that a median-income family earns more than the required income.
- Pending-sales conversion: A comparison of pending contracts with completed sales over a defined period or cohort. Because contracts and closings occur at different times, the measurement window matters.
- Median days on market: The midpoint of the time properties spend listed, according to the source's chosen start and end events. Check whether the measure ends at contract, closing, or another milestone.
- Year-over-year and month-over-month change: Year-over-year compares a period with the same period in the prior year; month-over-month compares adjacent months. The first can reduce seasonal effects, while the second can show more immediate movement.
Researchers collecting public listing or market information should also account for access, permissions, and the source's terms. A tool such as Scrapfly Unblocker may be relevant to teams evaluating compliant access workflows, but it doesn't replace source verification or a dataset's documentation.
Virtual Tour Easy helps real estate teams create immersive 360° property tours from text prompts, regular photos, or existing 360° images, then share them through links, embeds, and Google Street View. Its tour analytics and lead capture tools can complement Midwest market dashboards by connecting regional context with how prospects explore individual properties. Visit Virtual Tour Easy to see how virtual tours can support property presentation and remote buyer evaluation.