GA4 is Google's current web and app analytics platform, measuring user interactions as events across websites and apps while replacing Universal Analytics. By 2026, independent trackers estimated that GA4 was deployed on roughly 14.2 million to 15 million active websites worldwide, so a virtual tour owner is likely to encounter it whether the business operates a single property site or a large portfolio.
A real estate marketer opens an old dashboard before a client meeting and finds that the Universal Analytics numbers have stopped moving. The meeting still needs a clear answer: what replaced the old reports, and can the new system show whether visitors explored the virtual tour?
Table of Contents
- The Quick Answer for Curious Site Owners
- Why Google Rebuilt Analytics From the Ground Up
- GA4 vs Universal Analytics in Plain English
- How the Event-Based Model Actually Works
- Privacy Modeling and What It Means for Your Data
- Connecting GA4 to VirtualTourEasy Step by Step
- Reading Your Tour Reports and Building Custom Insights
- When to Go Beyond the Standard GA4 Setup
The Quick Answer for Curious Site Owners
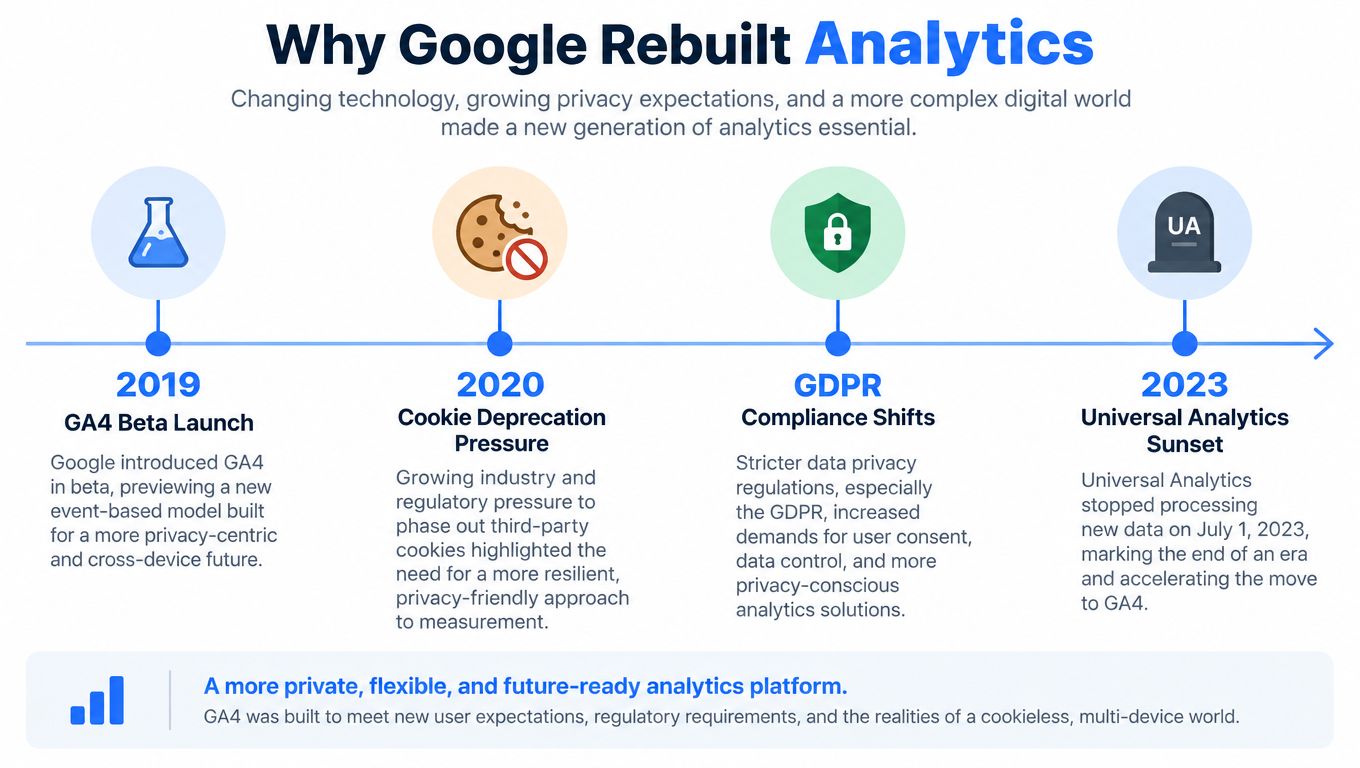
The direct answer is simple: GA4 is Google's current web and app analytics platform that measures user interactions as events across websites and apps, replacing Universal Analytics. Google's transition became official when GA4 launched on October 14, 2020, after the earlier App + Web beta had started in July 2019. Google later announced the sunsetting of Universal Analytics on March 16, 2022, with standard Universal Analytics properties stopping new data processing on July 1, 2023. Analytics 360 properties followed on July 1, 2024. The full transition is documented in this GA4 release timeline.
For a virtual tour operator, the important change isn't the product name. It's the way GA4 describes behavior. Universal Analytics organized activity around sessions, pageviews, and hits. GA4 treats each meaningful interaction as an event, such as opening a tour, changing a scene, selecting a hotspot, submitting a lead form, or completing a booking action.
A pageview can show that someone loaded the page containing a tour. It can't, by itself, explain whether the visitor explored the kitchen, opened the floor-plan hotspot, switched to full-screen mode, or left after the first scene. An event-based model can represent each of those actions separately, with additional context attached to the event.
GA4 also aims to connect journeys across websites and apps while working with less reliable identifiers and consent limitations. That makes it better suited to a buyer who researches a property on a phone, opens the tour later on a laptop, and returns to request a viewing from another device, although the resulting figures may still include modeled or incomplete data.
The practical outcome is twofold. First, tour owners need to understand what GA4 can reliably measure and what it may estimate. Second, the tour needs a deliberate event setup so the reports describe tour behavior, not just page loading. The following sections build that model and map it to a VirtualTourEasy implementation.
Why Google Rebuilt Analytics From the Ground Up
Analytics had to adapt to a web where visitors move between phones, websites, apps, video platforms, and consent choices. A visitor may discover a hotel through a search result, watch a property video, open a 360-degree tour on a phone, return through a desktop browser, and submit an enquiry after a later visit. A system built mainly around a browser session has difficulty treating those actions as one meaningful journey.
Google introduced App + Web as a beta in July 2019 and launched GA4 publicly on October 14, 2020. The later Universal Analytics sunset forced organizations to change their reporting, tagging, and attribution practices rather than just rename an existing dashboard. The transition created a new measurement approach centered on events and users, rather than relying primarily on sessions and pageviews.
Three design choices matter most for property marketers:
- Consent-aware measurement: GA4 can adjust collection and reporting according to the visitor's consent state. Missing identifiers don't automatically mean that every report becomes useless, but the system may need to model some behavior.
- Cross-platform identity: GA4 can use available signals such as device information, signed-in user identifiers, and configured reporting identity options. The result is an attempt to understand a journey across touchpoints, not just one browser visit.
- A shared event structure: Web and app interactions can be expressed as events with names and parameters. A tour scene view and an app screen view therefore fit the same broad measurement logic.
Practical rule: A tour report should answer what a visitor did, not merely which URL loaded.
Privacy constraints make this distinction especially important. GA4 is not a perfect camera recording of every visitor. Consent choices, ad blockers, browser restrictions, identifier loss, and data thresholds can reduce observable detail. Google's ongoing GA4 Measurement Protocol changelog also shows that the platform continues to evolve, including diagnostics and event-validation changes.
For a hospitality group, this means a reported tour completion is a useful signal, not an unquestionable census. A marketer can still compare scenes, traffic sources, and key actions, but decisions should account for the conditions under which data was collected.
GA4 vs Universal Analytics in Plain English
The clearest comparison is operational. Universal Analytics was organized around a session-based web model. GA4 treats the individual interaction as the basic unit and gives each event room for additional context.
GA4 vs Universal Analytics at a Glance
| Dimension | Universal Analytics | GA4 |
|---|---|---|
| Data model | Hits and sessions grouped activity into visits | Events represent individual interactions |
| Tour behavior | A scene change could remain invisible unless separately configured | A scene change can become a named event with parameters |
| Identity | Common implementations relied heavily on a browser client identifier | Reporting can combine available device, user, and consent-aware signals |
| Reporting | Predefined reports emphasized standard acquisition and behavior views | Reports and Explorations support funnels, paths, segments, and custom analysis |
| Engagement | Bounce rate described a limited form of session behavior | Engaged sessions and engagement rate describe interaction differently |
| Business actions | Goals represented important outcomes | Important events can be marked as key events for analysis |
| Platform scope | Primarily designed around websites | Designed for web and app measurement in one event framework |
The tour example shows why the difference matters. In Universal Analytics, a visitor could load a property page and move through ten scenes without creating another pageview. The session might show one page visit, even though the visitor engaged extensively with the tour. GA4 can record those actions as events such as tour_scene_view, hotspot_click, and tour_complete.
Identity is more complicated than a simple replacement of one identifier with another. GA4 still cannot magically prove that two anonymous browsers belong to the same individual. It can use configured user IDs and available signals where permitted, but privacy restrictions can leave gaps. A cross-device path should therefore be interpreted as a measured or modeled journey, not guaranteed person-level truth.
The reporting experience also changes. Rather than expecting every answer in a fixed report, an analyst often builds an Exploration. A free-form table can compare scenes, a funnel can show where visitors stop, and a path analysis can reveal what actions follow a tour start.
The practical distinction: Universal Analytics counted visits to pages. GA4 describes a stream of events, with the tour interaction itself becoming the object of analysis.
The old goal-versus-new key-event terminology can also confuse teams. The important business question remains the same: which actions signal progress, such as a completed tour, a lead form submission, or a booking request? The label and setup path have changed, but the measurement decision still belongs to the business.
How the Event-Based Model Actually Works
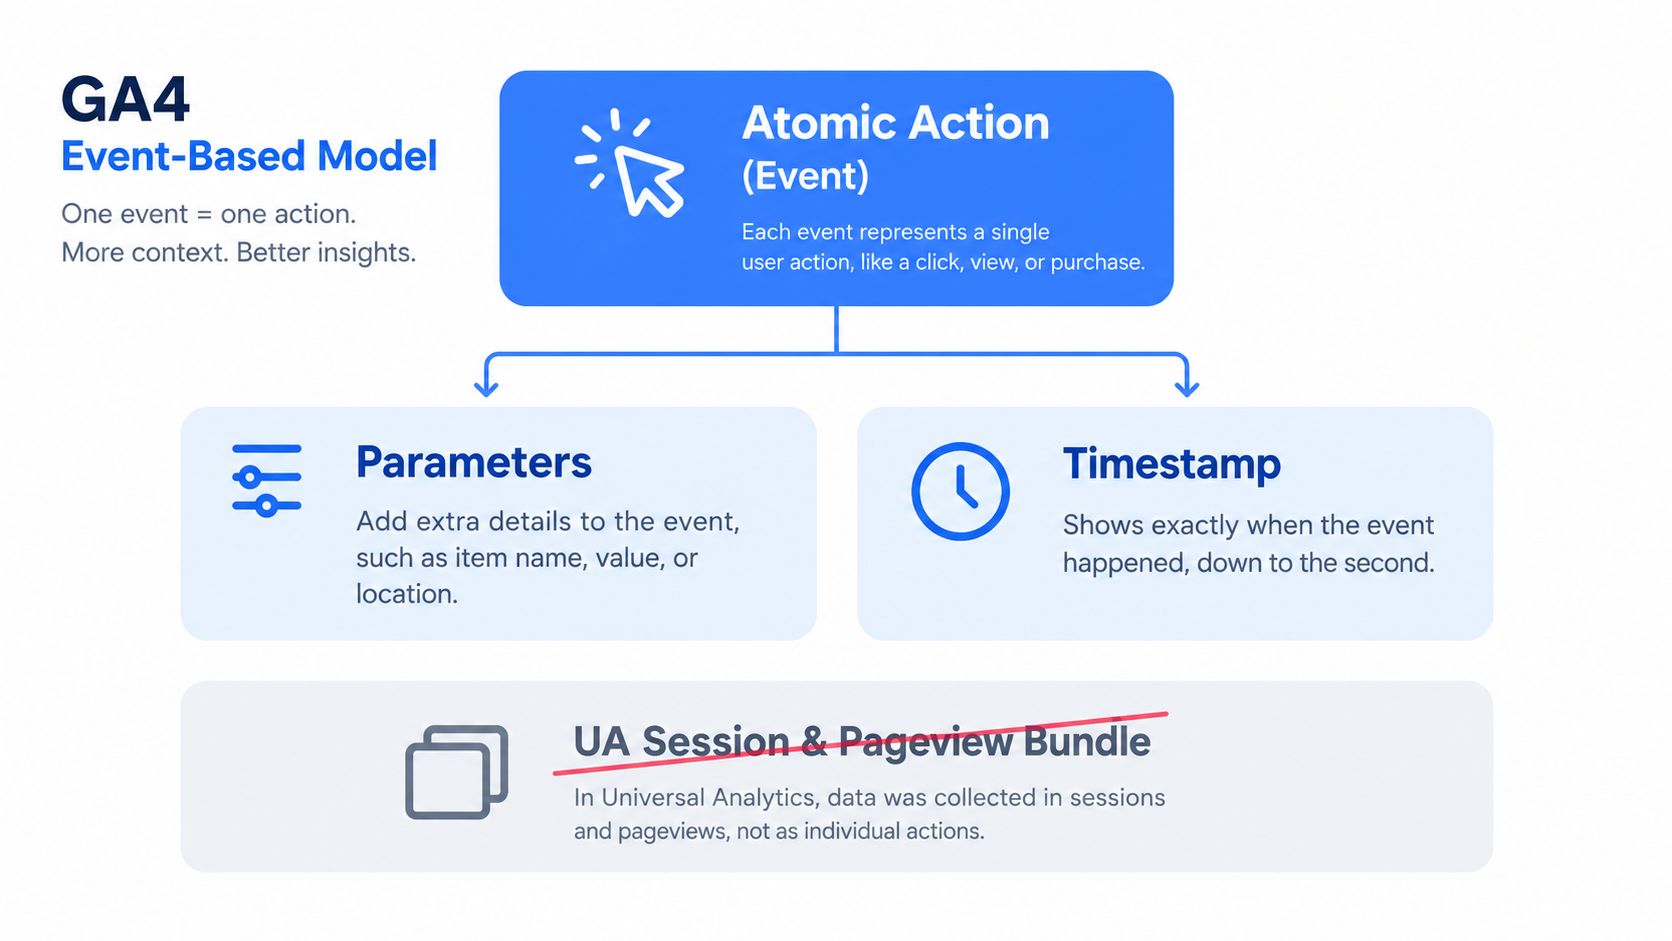
An event is one atomic action at a point in time. A visitor starts a tour, opens a hotspot, moves to another panorama, or submits a form. Each action can carry a name and supporting parameters.
The model becomes easier to manage when events are grouped into four layers.
Start with events GA4 can collect automatically
GA4 can collect foundational activity such as page_view, first_visit, and session_start. These events establish that a page loaded, a visitor arrived for the first time, or a new session began.
They aren't enough to explain tour engagement. A pageview confirms that the page containing the player loaded, but it doesn't identify the scene that held attention or the hotspot that generated interest.
Add enhanced measurement where it fits
Enhanced Measurement can capture common website interactions without a custom event for every action. Depending on the configured data stream, examples include scrolls, outbound clicks, video activity, file downloads, and site search.
These automatic interactions are useful for the page around the tour. They shouldn't be treated as a complete virtual-tour analytics plan because a specialized player has its own interaction vocabulary.
Use recommended events when the action matches
Recommended events provide established names for common actions such as login, sign_up, purchase, and view_item. Consistent naming makes reports easier to understand and can help connected Google products interpret the data.
A booking request may fit a recommended event, while a scene transition probably needs a tour-specific name.
Create custom events for tour behavior
A virtual-tour player needs custom events for actions that standard website tracking can't describe. A VirtualTourEasy implementation might send:
tour_scene_view, withtour_scene_name,scene_order, andview_modetour_dwell, withtour_scene_nameand dwell durationhotspot_click, with hotspot name and scene contexttour_complete, when the visitor reaches the defined completion action
The event name identifies the action. Parameters explain its context. A user property can describe a longer-lived audience characteristic, such as visitor_type or listing_market, provided the value doesn't contain personally identifiable information.
The same principle applies to a scene change. Instead of recording a vague interaction, the implementation can identify the scene, order, player mode, and time spent. The report can then distinguish a visitor who briefly opened the first scene from one who explored several rooms and opened a contact hotspot.
A useful naming test: If a property owner can read the event name and understand what happened without opening a technical document, the name is probably doing its job.
Privacy Modeling and What It Means for Your Data
GA4 should be treated as a privacy-aware measurement system, not a complete visitor recording. Consent choices influence what can be collected, identifiers may be unavailable, and some reports may suppress details when the available audience is too small.
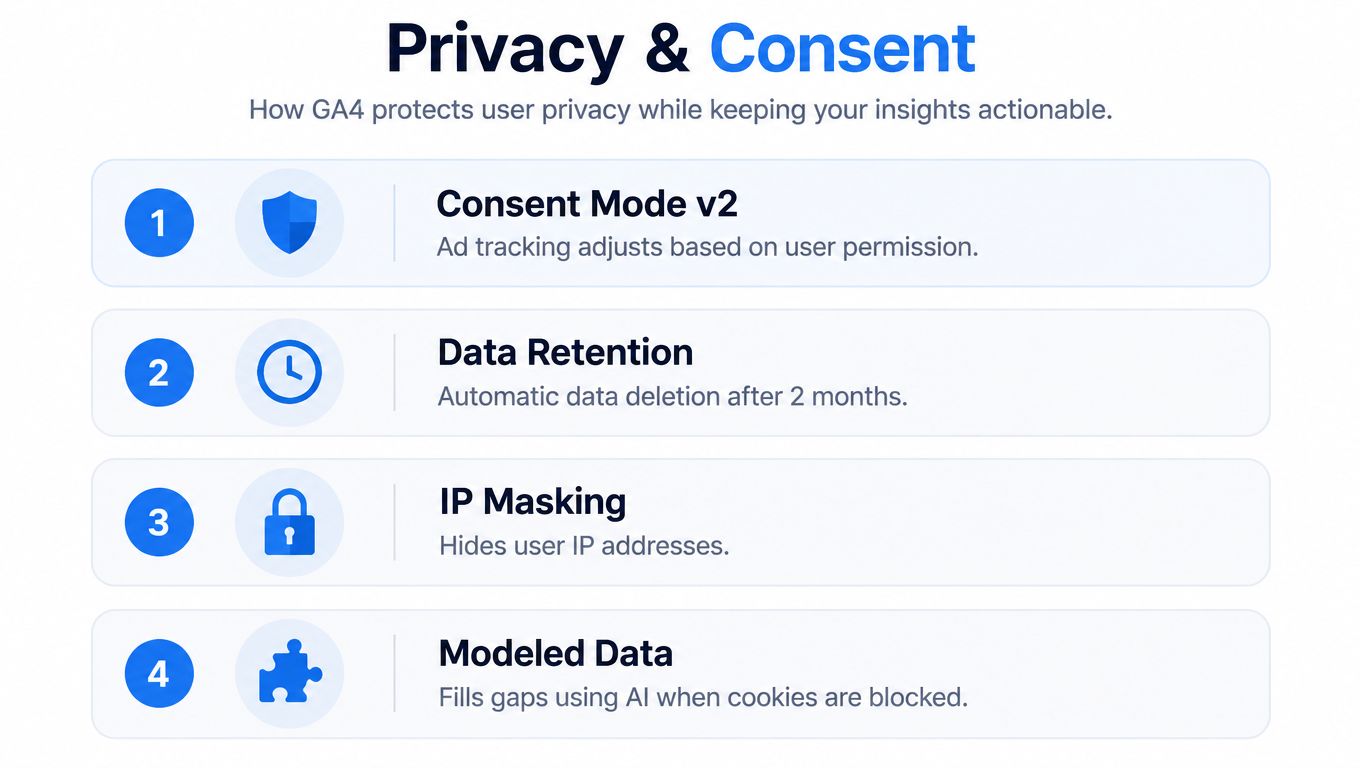
Consent Mode uses signals such as ad_storage, analytics_storage, ad_user_data, and ad_personalization to communicate the visitor's choices to Google tags. When analytics storage isn't granted, reporting may still use modeled information in supported configurations, but that modeled information represents an estimate rather than a directly observed event stream.
Demographic and identity reports can also show less detail for small or sensitive groups. A niche property listing may therefore display insufficient data instead of exposing a thin audience row. That isn't necessarily a broken tag. It can be the expected result of privacy protections.
The trade-off for tour operators
A consent-aware setup gives visitors greater control and helps a property business make a clearer distinction between directly observed and modeled activity. The cost is reduced granularity. Remarketing audiences may be smaller, device paths may be incomplete, and channel attribution may not reconcile with CRM records.
The measurement decision should be explicit:
- Collection quality: Confirm that the consent banner communicates the correct states to GA4.
- Data minimization: Keep event parameters focused on useful context and exclude names, email addresses, phone numbers, and other personal details.
- Reporting interpretation: Label modeled or estimated results internally so decision-makers don't mistake them for a complete count.
- Retention and access: Review data retention, user access, and deletion settings as part of the launch process.
For a practical explanation of the consent layer, property teams can review user consent management for virtual tours.
The most important habit is to separate measurement confidence from business usefulness. A modeled trend can still help a hotel compare landing pages, but it shouldn't be presented as a precise count of every individual guest.
Connecting GA4 to VirtualTourEasy Step by Step
A practical setup starts with one web stream and a small, documented event plan. VirtualTourEasy includes GA4 integration and tour analytics features, so the operator can connect the tour experience to the property website's broader measurement system.
Create the GA4 property and web stream. In Google Analytics, create a GA4 property within the existing account and choose a web stream. Enter the domain that hosts the tour or the connected website, then copy the Measurement ID in the
G-XXXXXXXformat. The ID identifies the destination for the collected events.Paste the ID into the tour integration settings. In the VirtualTourEasy dashboard, open the tour's Settings area and locate Integrations or Analytics. Paste the Measurement ID into the Google Analytics field. Enhanced Measurement can remain enabled for standard website interactions, but it shouldn't replace custom tracking for tour scenes and hotspots.
Enable the tour analytics module. Activate the integration so the embedded viewer can send events such as
tour_scene_view,tour_dwell, andtour_completion. Useful parameters include the scene name, scene order, and dwell time. The exact event names should be recorded in an implementation sheet before launch because consistent naming prevents duplicate or ambiguous reports.Register the custom definitions. In GA4, open Admin, then Data Streams, and check the tag settings and Enhanced Measurement configuration. Register
tour_scene_nameas a custom dimension if the team needs to use it in Explorations and other reports. Sending a parameter and registering it for reporting are separate tasks.Test in DebugView. Open the tour in a private browsing window, interact with several scenes, and inspect DebugView in GA4. Confirm that the event names appear and that the parameters contain the expected values. The test should cover a scene change, a hotspot interaction, a completion action, and a lead form if the tour includes one.
Teams that need a broader implementation reference can use this guide to track conversions with GA4. A tour that requires Google Tag Manager can also follow the Google Tag Manager setup guide.
If events don't appear, check the Measurement ID for typing errors, confirm that the integration is enabled, and review whether an ad blocker or privacy extension is preventing collection. The consent banner may also hold tags until permission is granted. DebugView and real-time reports can show activity before standard reports are populated, so a delay in the latter doesn't automatically mean the implementation failed.
Reading Your Tour Reports and Building Custom Insights
GA4 becomes useful when the report reflects a decision the property team makes. A dashboard full of event counts isn't enough. The operator needs to know which scenes attract attention, which interactions indicate intent, and where visitors stop exploring.
The Reports Snapshot provides an initial orientation. For a tour business, the most relevant areas usually include Engagement, Monetization where applicable, and User Attributes. Engagement helps identify active behavior, while monetization and user attributes add business or audience context when the available data supports those reports.
Build a scene-level Exploration
Open Explore and choose a Free Form exploration. Add dimensions such as:
tour_event_name, includingscene_view,hotspot_click, andtour_completetour_scene_idor the registeredtour_scene_name- Device category or traffic source when comparing acquisition contexts
Useful metrics include event_count, engagement time, and the number of users or sessions available for the chosen report. Filters should isolate the tour events rather than mixing them with ordinary pageviews.
A funnel can start with tour_start and end with tour_complete. Intermediate steps can include a scene view, a hotspot click, and a lead form submission. The funnel doesn't prove why a visitor stopped, but it identifies where the measured sequence narrows.
Turn reports into decisions
Two practical measures deserve attention. Average engagement time per scene indicates which rooms or areas hold attention. The view-to-click ratio for hotspots shows whether a call to action attracts action after visitors see it. A scene with long engagement and few hotspot clicks may need clearer prompts. A scene with frequent clicks and short engagement may signal strong intent or confusing navigation.
Teams reviewing visitor behavior can also consult this visitor behavior analysis guide. The analysis should compare similar tours or periods rather than treating one isolated event count as a verdict.
Save the completed Exploration as a report and pin it to the left navigation. A weekly review can then focus on scene-level attention, completion paths, and lead actions instead of rebuilding the same analysis each time.
When to Go Beyond the Standard GA4 Setup
The GA4 interface is a useful working surface, but it isn't the same as a durable analytics warehouse. It helps an operator inspect reports and build Explorations. It isn't always the right place to preserve every raw event, combine CRM records, or audit server-side conversions.
GA4 Setup Options Compared
| Setup Option | Best For | Cost | Upgrade Trigger |
|---|---|---|---|
| Standard GA4 interface | Learning questions, checking events, and reviewing core reports | Included within the standard platform setup | The team needs repeatable analysis beyond built-in reports |
| BigQuery export | Raw event-level analysis, long-term storage, and advanced joins | BigQuery usage and query charges may apply | The team needs SQL, raw history, or cross-system analysis |
| Measurement Protocol | Offline actions, backend events, CRM updates, and delayed interactions | Development and maintenance effort | Important conversions happen outside the browser |
| Server-side Google Tag Manager | Greater control over event processing and data sent to vendors | Hosting and technical maintenance effort | The team needs server-side routing or stronger control over sensitive parameters |
GA4's BigQuery export exposes raw, unsampled event data with one row per event and nested records such as event_params, user_properties, device, geo, and traffic_source. Google documents a daily export limit of 1 million events for standard properties, while streaming export has no event-volume limit but adds BigQuery charges of $0.05 per gigabyte. These details are available in Google's BigQuery Export documentation.
Measurement Protocol provides a server-to-server collection layer over HTTP. It suits offline bookings, kiosk interactions, CRM updates, or delayed backend actions that never pass through a browser tag. Google notes that session-based events need a valid session_id; without one, attribution can appear as (not set) / (not set). The official GA4 Measurement Protocol documentation explains the implementation requirements.
Decision rule: Stay in the GA4 interface while the team is learning which questions matter. Export to BigQuery when pricing, budget, or portfolio decisions start depending on raw event data.
A server-side Google Tag Manager container can add another control point for teams that need to process events before sending them to other platforms. It can help remove unnecessary personal data and route events more deliberately, but it also adds technical responsibility. The right upgrade is the simplest one that solves a known measurement problem, not an extra layer added for prestige.
Virtual Tour Easy provides a way to create and publish immersive 360-degree tours, add scenes and interactive elements, capture tour analytics, and connect measurement tools such as GA4 and Google Tag Manager. Property teams can visit Virtual Tour Easy to create a tour, connect the event setup, and start measuring how visitors explore spaces before they schedule an in-person visit.